
Pearl's odometer passed 43,000 miles when I rolled into my driveway on Tuesday, October 23 and Snow Bear passed 4,000 miles the next day, Wednesday, October 24, so it's time for an Oil and gas price report plus a double driving update. I begin with Reuters reporting via CNBC yesterday US crude posts third straight weekly loss, settling at $67.59, as equities slump.
Oil prices were higher on Friday, supported by expectations that sanctions on Iran would tighten supplies, but crude futures still dropped for a third straight week as a slump in stock markets and concerns about trade wars clouded the fuel demand outlook.The good news is that Brent crude oil is lower than it was at my last report in late August, when it was $77.64. So is U.S. light crude, which was $69.91. The bad news is that both were much higher earlier in the month, when MarketWatch reported on October 3 Oil prices rally back to nearly 4-year highs despite biggest weekly U.S. crude supply rise of the year.
U.S. crude ended Friday's session 26 cents higher at $67.58, posting a loss of 2.2 percent loss this week. The contract rose in four out of five sessions this week, but the gains were not enough to offset a nearly $3 drop on Tuesday.
Brent crude oil was trading around $77.61 a barrel, up 72 cents, by 2:29 p.m. ET , after earlier falling more than $1 to a low of $75.77. The contract is on course for a weekly loss of nearly 3 percent. It has fallen by more than $10 in the last three weeks.
November West Texas Intermediate crude US:CLX8 the U.S. benchmark contract, added $1.18, or 1.6%, to settle at $76.41 a barrel on the New York Mercantile Exchange, but had dropped near the day’s low of $74.30 immediately after the supply data.MarketWatch blamed this on the U.S. withdrawing from Iran nuclear agreement and the resulting sanctions, which will be implemented next month. That's more bad news, although something I expected. The good news is that falling crude oil prices along with lower driving demand are finally causing retail gasoline prices to start dropping, which KSTP reported in Gas Prices are Falling Nationally in October.
December Brent LCOZ8, +1.09% rose $1.49, or 1.8%, to $86.29 a barrel on the ICE Futures Europe exchange after tapping lows near $84.
Both benchmark contracts marked their highest settlements since late 2014.
AAA reports gas prices are four cents cheaper than last week, yet they are 39 cents more than consumers were paying last year.Falling gas prices but still more expensive than last year — AAA reports the national average is $2.84 per gallon — that's pretty much what I expected.
“Motorists across the country are seeing gas prices more than a dime cheaper than last week, with 41 states having less expensive state averages on the week,” said Jeanette Casselano, AAA spokesperson. “Prices are falling despite market concerns about global supply and geopolitical tensions, but that could change later this month ahead of the U.S. announcement of imposed sanctions on Iran.”
As for how long this can go one, Foreign Policy argues Trump Can’t Put ‘Maximum Pressure’ on Tehran and Keep Gas Prices Low: "Something’s going to have to give, and it will probably be the sanctions."
On Nov. 4, U.S. sanctions on Iranian oil exports will go back into force after they were suspended following the 2015 Iran nuclear deal. Less than a month before that deadline, Iran’s oil sales are already tanking. The United States would like to see them fall further. In July, U.S. Secretary of State Mike Pompeo laid down a marker when he spoke at an event for Iranian dissidents. “Our focus is to work with countries importing Iranian crude oil to get imports as close to zero as possible by November 4th,” he said, before repeating “zero” for emphasis.Considering how resistant to reality the Trump Administration has been and how much they value looking "tough" — actually being cruel — it may take a while for them to relent. Fortunately for them and the American people, falling oil and gas prices might allow them to continue having their cake and eating it, too — for a while, maybe until next summer.
The problem with the “maximum pressure” campaign is that it is running headlong into another of U.S. President Donald Trump’s objectives: keeping gasoline prices low. After sharp increases in oil prices in May and June, and then again in September, Trump took to Twitter multiple times to shout at OPEC. He repeated the same complaints at the United Nations in New York last month. “OPEC and OPEC nations are, as usual, ripping off the rest of the world, and I don’t like it,” he said in his address. “Nobody should like it. We defend many of these nations for nothing, and then they take advantage of us by giving us high oil prices. Not good.” His remarks came just as Brent crude prices hit a nearly four-year high at more than $80 per barrel.
...
The more the United States tightens the screws on Iran, the harder it will be to prevent prices from rising further.
...
With Iran exporting oil at low levels, it might actually be the United States that ultimately pulls back from its aggressive posture. Trump administration officials have recently suggested that they are considering waivers for certain countries importing Iranian crude, a sign that the administration is feeling the pressure from higher energy prices. It could be that U.S. policymakers are realizing that the energy independence supposedly brought by soaring U.S. shale production was a mirage. It is true that net imports of crude have fallen sharply over the past decade as U.S. shale production has increased; in 2005, the United States depended on imports to meet 60 percent of its oil needs. That figure is now down to less than 15 percent. Nevertheless, U.S. motorists are still at the mercy of global oil prices. Higher shale output only lowers global prices insofar as it improves the global supply balance. And precisely because Iran sanctions have shrunk supplies, fuel prices across the world have climbed.
The United States may be one of the world’s largest oil producers, but it is not a swing producer. Its output comes from hundreds of individual privately owned oil companies, large and small. They all make unique business decisions and do not have the ability to bring extra supply online on short notice. As such, the United States doesn’t really have any spare capacity to offset a sudden tightening of the market.
Follow over the jump for the driving update.
It has been 55 days since Pearl passed 42,000 miles on August 29, 2018, which translates to 18.18 miles per day, 554.55 miles per month, and 6636.36 miles per year. That's a lot less than the average of 23.26 miles per day, 709.3 miles per standard month, and 8,488.4 miles per year I drove between July 17th and August 29th. As for the actual year over year comparison, it took me 392 days to drive Pearl another 7,000 miles since she passed 36,000 miles on September 26, 2018, which becomes 17.86 miles per day, 544.64 miles per month, and 6,517.86 miles per year. Despite my traveling across the state, I am still holding to my goal of 6,500 miles per year.
It has been 96 days since Snow Bear passed 3,000 miles on July 20, 2018, which translates to 10.42 miles per day, 317.71 miles per month, and 3802.08 miles per year. That's more than the 8.55 miles per day, 260.68 miles per standard month, and 3119.7 miles per year my wife and I drove the car from March 25, 2018 to July 20, 2018. Most of a trip to Chicago to visit our daughter is in there, so I am not surprised.
Again, the important statistic is how much we drove our cars together. It took us an average of 97 days to drive 3,000 miles. That translates to 30.93 miles per day, 943.30 miles per month, and 11,288.66 miles per year. That's a lot more than the 25.42 miles per day, 773.31 miles per month, and 9279.7 miles per year we drove together between March and July. We are definitely contributing to the slow increase in miles driven by Americans. From DShort.com.
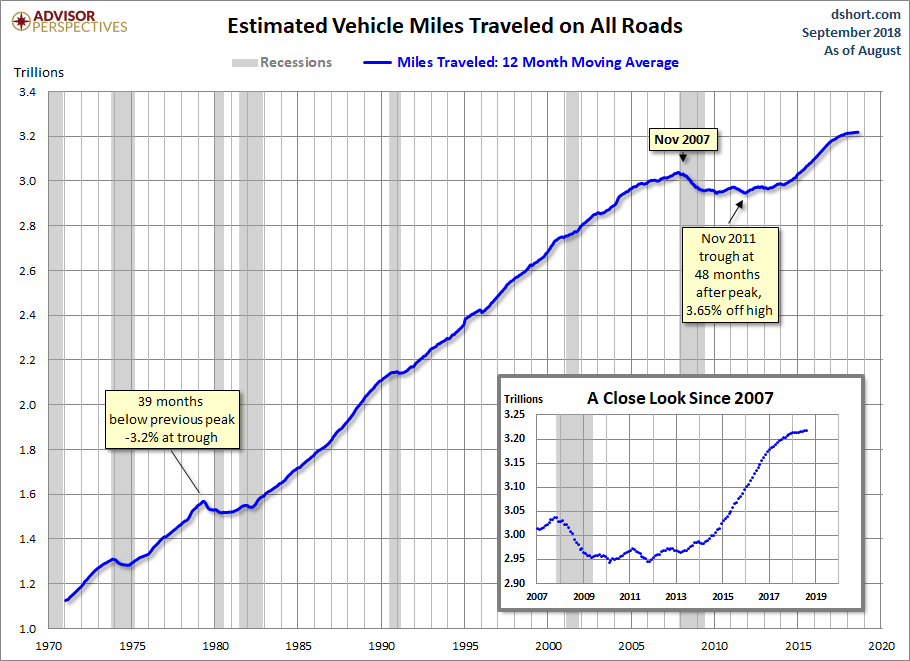
The Department of Transportation's Federal Highway Commission has released the latest report on Traffic Volume Trends, data through August.
"Travel on all roads and streets changed by +0.3% (+0.8 billion vehicle miles) for July 2018 as compared with July 2017. Travel for the month is estimated to be 288.1 billion vehicle miles." The 12-month moving average was unchanged month-over-month and up 0.4% year-over-year. If we factor in population growth, the 12-month MA of the civilian population-adjusted data (age 16-and-over) is down 0.09% month-over-month and down 0.6% year-over-year.
Here is a chart that illustrates this data series from its inception in 1971. It illustrates the "Moving 12-Month Total on ALL Roads," as the DOT terms it. As we can readily see, the Great Recession had a substantial impact on our driving habits, but have bounced back since.
As for what the future holds, we plan on driving to Chicago next month, so expect Snow Bear's miles to remain high.
No comments:
Post a Comment