WISH-TV didn't provide a video description, so I'm quoting The Hill.
A study by researchers at the Urban Institute, the University of Colorado and Virginia Commonwealth University (VCU) estimated that the U.S. life expectancy dropped last year to 76.6 years, down more than two years from the rate in 2019. At the same time, life expectancy rates in other wealthy countries increased between 2020 and 2021, after registering a smaller decrease the year before.As I wrote last year, "the pandemic is responsible for most of the drop, [but] other causes, like the opioid epidemic and systemic racism making the pandemic worse for minorities, played roles in lowering life expectancy." All of this is still true, which is why I also wrote "returning to the pre-pandemic normal isn't good enough."
“While other high-income countries saw their life expectancy increase in 2021, recovering about half their losses, U.S. life expectancy continued to fall,” VCU sociologist Steven Woolf, one of the study’s authors, said in a statement. “This speaks volumes about the life consequences of how the U.S. handled the pandemic, and in a country where the U.S. Constitution and the 10th Amendment grant public health authority to the states, I believe the U.S. catastrophe speaks volumes about the policies and behaviors of U.S. governors — at least some of them.”
Life expectancy has dropped the most in recent years among Hispanic and Black populations, which researchers attributed to “the legacy of systemic racism and inadequacies in the U.S. handling of the pandemic.”
Ryan Masters, a sociologist at the University of Colorado and the study’s lead author, said high rates of obesity and heart disease made the U.S. population more vulnerable to the coronavirus pandemic than populations in other wealthy countries.
Follow over the jump for total U.S. deaths last year and the effect on the populations of states.
Last year, I quoted the Associated Press reporting "More than 3.3 million Americans died last year, far more than any other year in U.S. history, with COVID-19 accounting for about 11% of those deaths." The number of deaths continued to rise, as the Census Bureau reported last month.
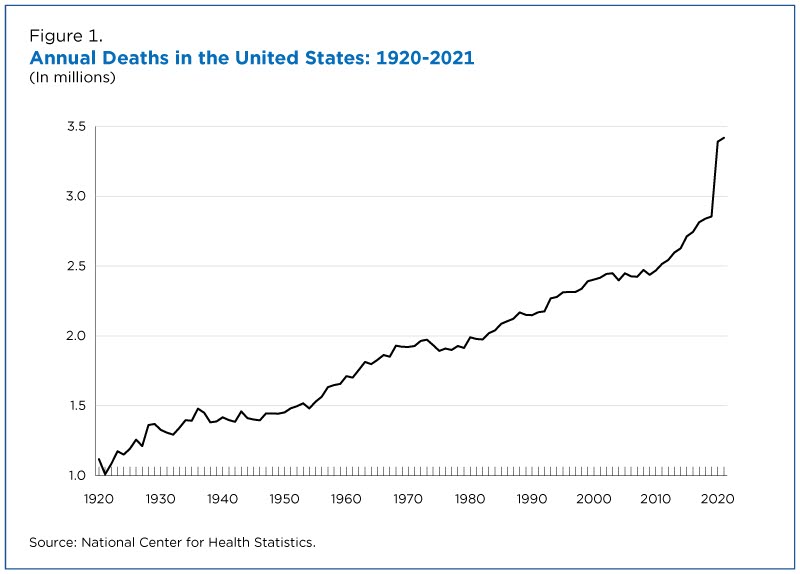
Deaths in the United States increased by 19% between 2019 and 2020 following the onset of the COVID-19 pandemic in March 2020 — the largest spike in mortality in 100 years.Here is Figure 1, showing both the gradual increase in total annual deaths, which should be expected given both the increased total population and general aging of the population, and the spike in deaths during the pandemic.
And deaths remained elevated in 2021 as the threat of the COVID-19 pandemic continued, according to the U.S. Census Bureau’s July 1, 2021, population estimates.
...
The annual increase in deaths in 2020 was the largest in 100 years. Deaths spiked almost 19% (535,191) between 2019 and 2020, from 2,854,838 to 3,390,029.
For the past century, deaths followed an overall trend of gradual, linear increase (Figure 1). Though deaths fluctuate from one year to the next, the annual changes observed were generally small in magnitude.

The report continues.
The last two years, however, represented an obvious departure from that pattern. Prior to 2020, the largest increase was in 1928 when deaths increased by 12%.The data series begins in 1920, so it doesn't include the effects of the 1918 flu pandemic. That might have shown an even greater percentage increase.
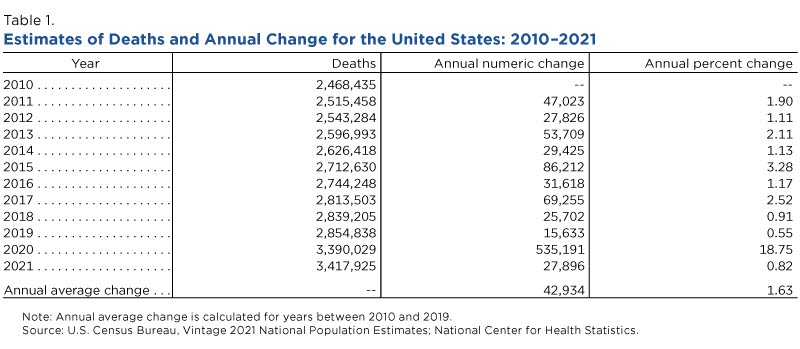
The next line of the report reads "Table 1 shows annual deaths for 2010 through 2021, highlighting more recent patterns in mortality." Here is the image.

From 2010 through 2019, the annual average increase in deaths was 42,934 or 1.63%, Prior to 2020, the largest annual percent increase this decade was 3.28% in 2015.As the second image shows, 3,417,925 Americans died last year, another record.
In 2020, COVID-19 became the third leading cause of death, surpassing all other causes except heart disease and cancer and driving the large increase in total U.S. deaths for that year.
Between 2020 and 2021, deaths increased by 0.82%.
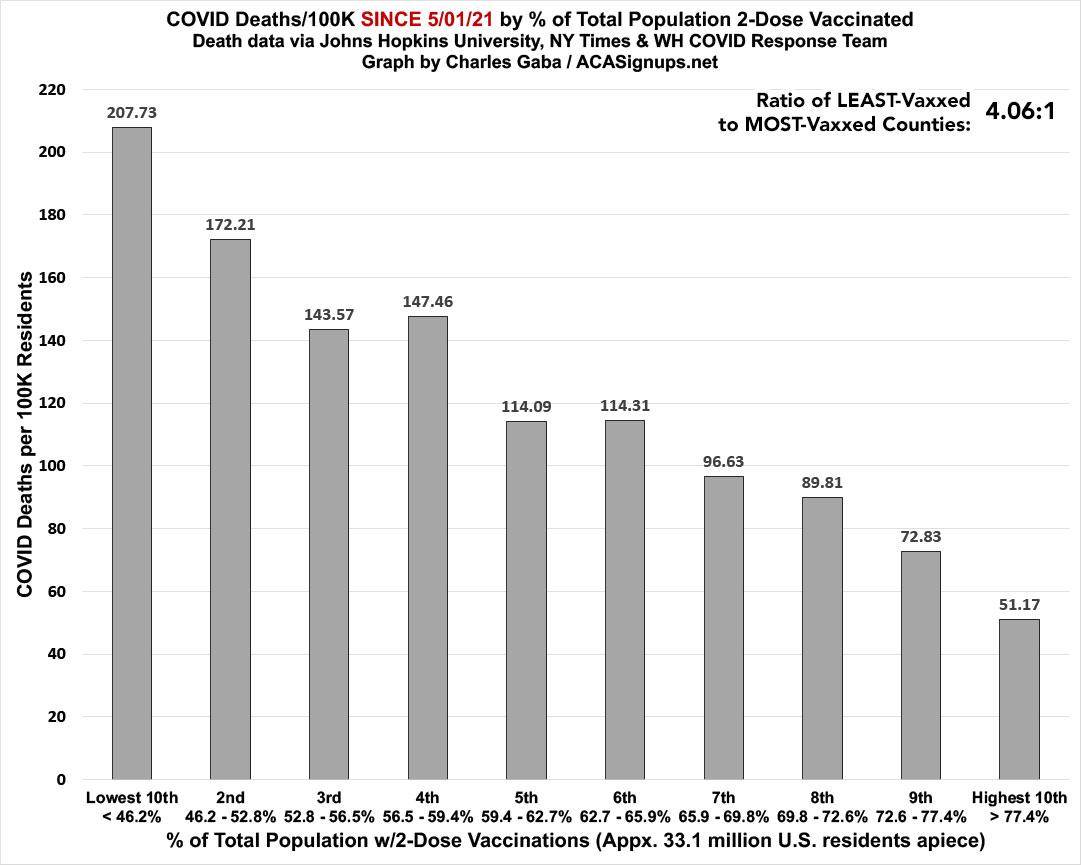
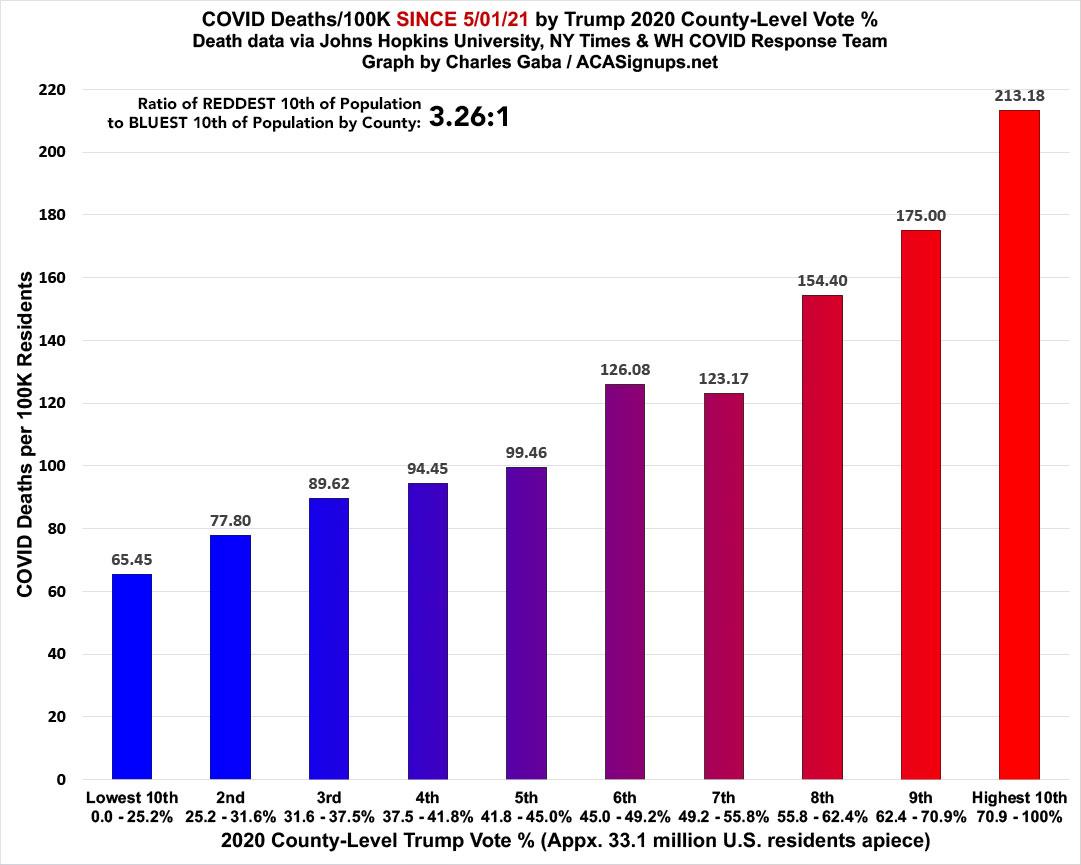
Deaths in 2021 were still up 19.7% from 2019, an indication that despite widespread availability of vaccines, COVID-19 continues to have a significant impact on mortality.As I noted two months ago, widespread availability of vaccines has not translated into universal acceptance of vaccines, as Charles Gaba pointed out again in Weekly Update: COVID Case/Death Rates by Partisan Lean & Vaccination Rate last week.

As always, what's even more disturbing is how closely the death rate by partisan lean matches the death rate by vaccination rate; they're nearly mirror images of each other:

On the one hand, sigh. On the other, Charles does very good work on health care and my readers should read him, too.
The final point I'm quoting from the report is "Half of all states and nearly three quarters of all counties experienced more deaths than births — known as natural decrease — in the 2021 estimates year." ABC News expanded on that in Census' estimates show half of U.S. states had more deaths than births from 2020 to 2021.
The data shows the impact of the COVID-19 pandemic on natural change in population in the U.S.Both blue and red states had more people die than born, including Michigan, all of New England, New Mexico, Oregon, Pennsylvania, and Wisconsin.
I plan on writing more about the pandemic this month, first a retrospective of the top posts on the topic last year and then an update when the U.S. passes one million deaths, which could happen by the end of the month. In the meantime, stay tuned for a celebration of Easter tomorrow.
No comments:
Post a Comment