Car safety was once an afterthought, but now automakers brag about their safety ratings from groups like IIHS or NHTSA’s New Car Assessment Program. The journey to this has been long, and in some cases, controversial. Fierce battles have been fought over whether automakers should have to stock cars with safety equipment, such as airbags, and whether people should be forced to wear seatbelts.I'm sharing this as a response of sorts to U.S. traffic deaths reached nearly 43,000 in 2021, the most in 16 years, a driving update. The increase in traffic deaths isn't the cars' fault; as I tell my students, cars are much safer now than they were in the 1960s early 1970s, when more than 50,000 Americans died each year in collisions and the like, as the following graph from Business Insider shows.
Now a raft of new safety technologies help prevent collisions from happening at all. Some automakers, such as General Motors are aspiring to a world with no crashes.
While some of these new safety technologies are promising, they often rely on automation to achieve their goals, and automation brings its own risks, such as distraction, confusion, or a false sense of security.
In the meantime, the number of traffic deaths in America has risen in recent years, after hitting an all-time low in 2014. Experts are trying to figure out why, and what to do to reverse the trend.
I expect all the safety and other driver assistance technologies described in the videos will make cars even safer in the future, although I don't expect they will eliminate all traffic fatalies in 30 years, although I called it a worthy if unattainable goal six years ago.
Instead, the drivers are causing the increased deaths, first through distracted driving, then speeding during the pandemic, which has persisted.* That's individual bad behavior having a collective effect. On the other hand, I'm not going to fault individuals for driving more, which also increases aggregate traffic deaths, even if the death rate per miles driven stays constant or even decreases, as it did last year and so far this year.
That's the big picture. Follow over the jump for my personal driving update.

I rolled Snow Bear's odometer past 10,000 miles on Tuesday, November 15, 2022. That's 281 days since she rolled past 9,000 miles on Monday, February 7, 2022, resulting in averages of 3.56 miles per day, 108.54 miles per standard month, and 1,298.23 miles per year. That's more than the 3.05 miles per day, 92.99 miles per standard month, and 1112.80 miles per standard year i drove her between March 16, 2021 and February 7, 2022, but still less than the 4.17 miles per day, 127.08 miles per standard month, and 1,520.83 miles per standard year my wife and I drove her between July 26, 2020 and March 16, 2021.
Adding Snow Bear's 3.56 miles per day, 108.54 miles per standard month, and 1,298.23 miles per year to Pearl's 8.13 miles per day, 247.97 miles per standard month, and 2,967.45 miles per standard year yields total averages of 11.69 miles per day, 356.48 miles per standard month, and 4,265.68 miles per year. That's slightly more than the 10.91 miles per day, 332.76 miles per standard month, and 3,982.17 miles per year I estimated I drove both cars in March 2022. I may be adding to the total miles driven by Americans, but not by much.
By the way, Advisor Perspectives shows that miles driven actually declined a bit this spring and summer, most likely because of higher gas prices, but increased again during August 2022.
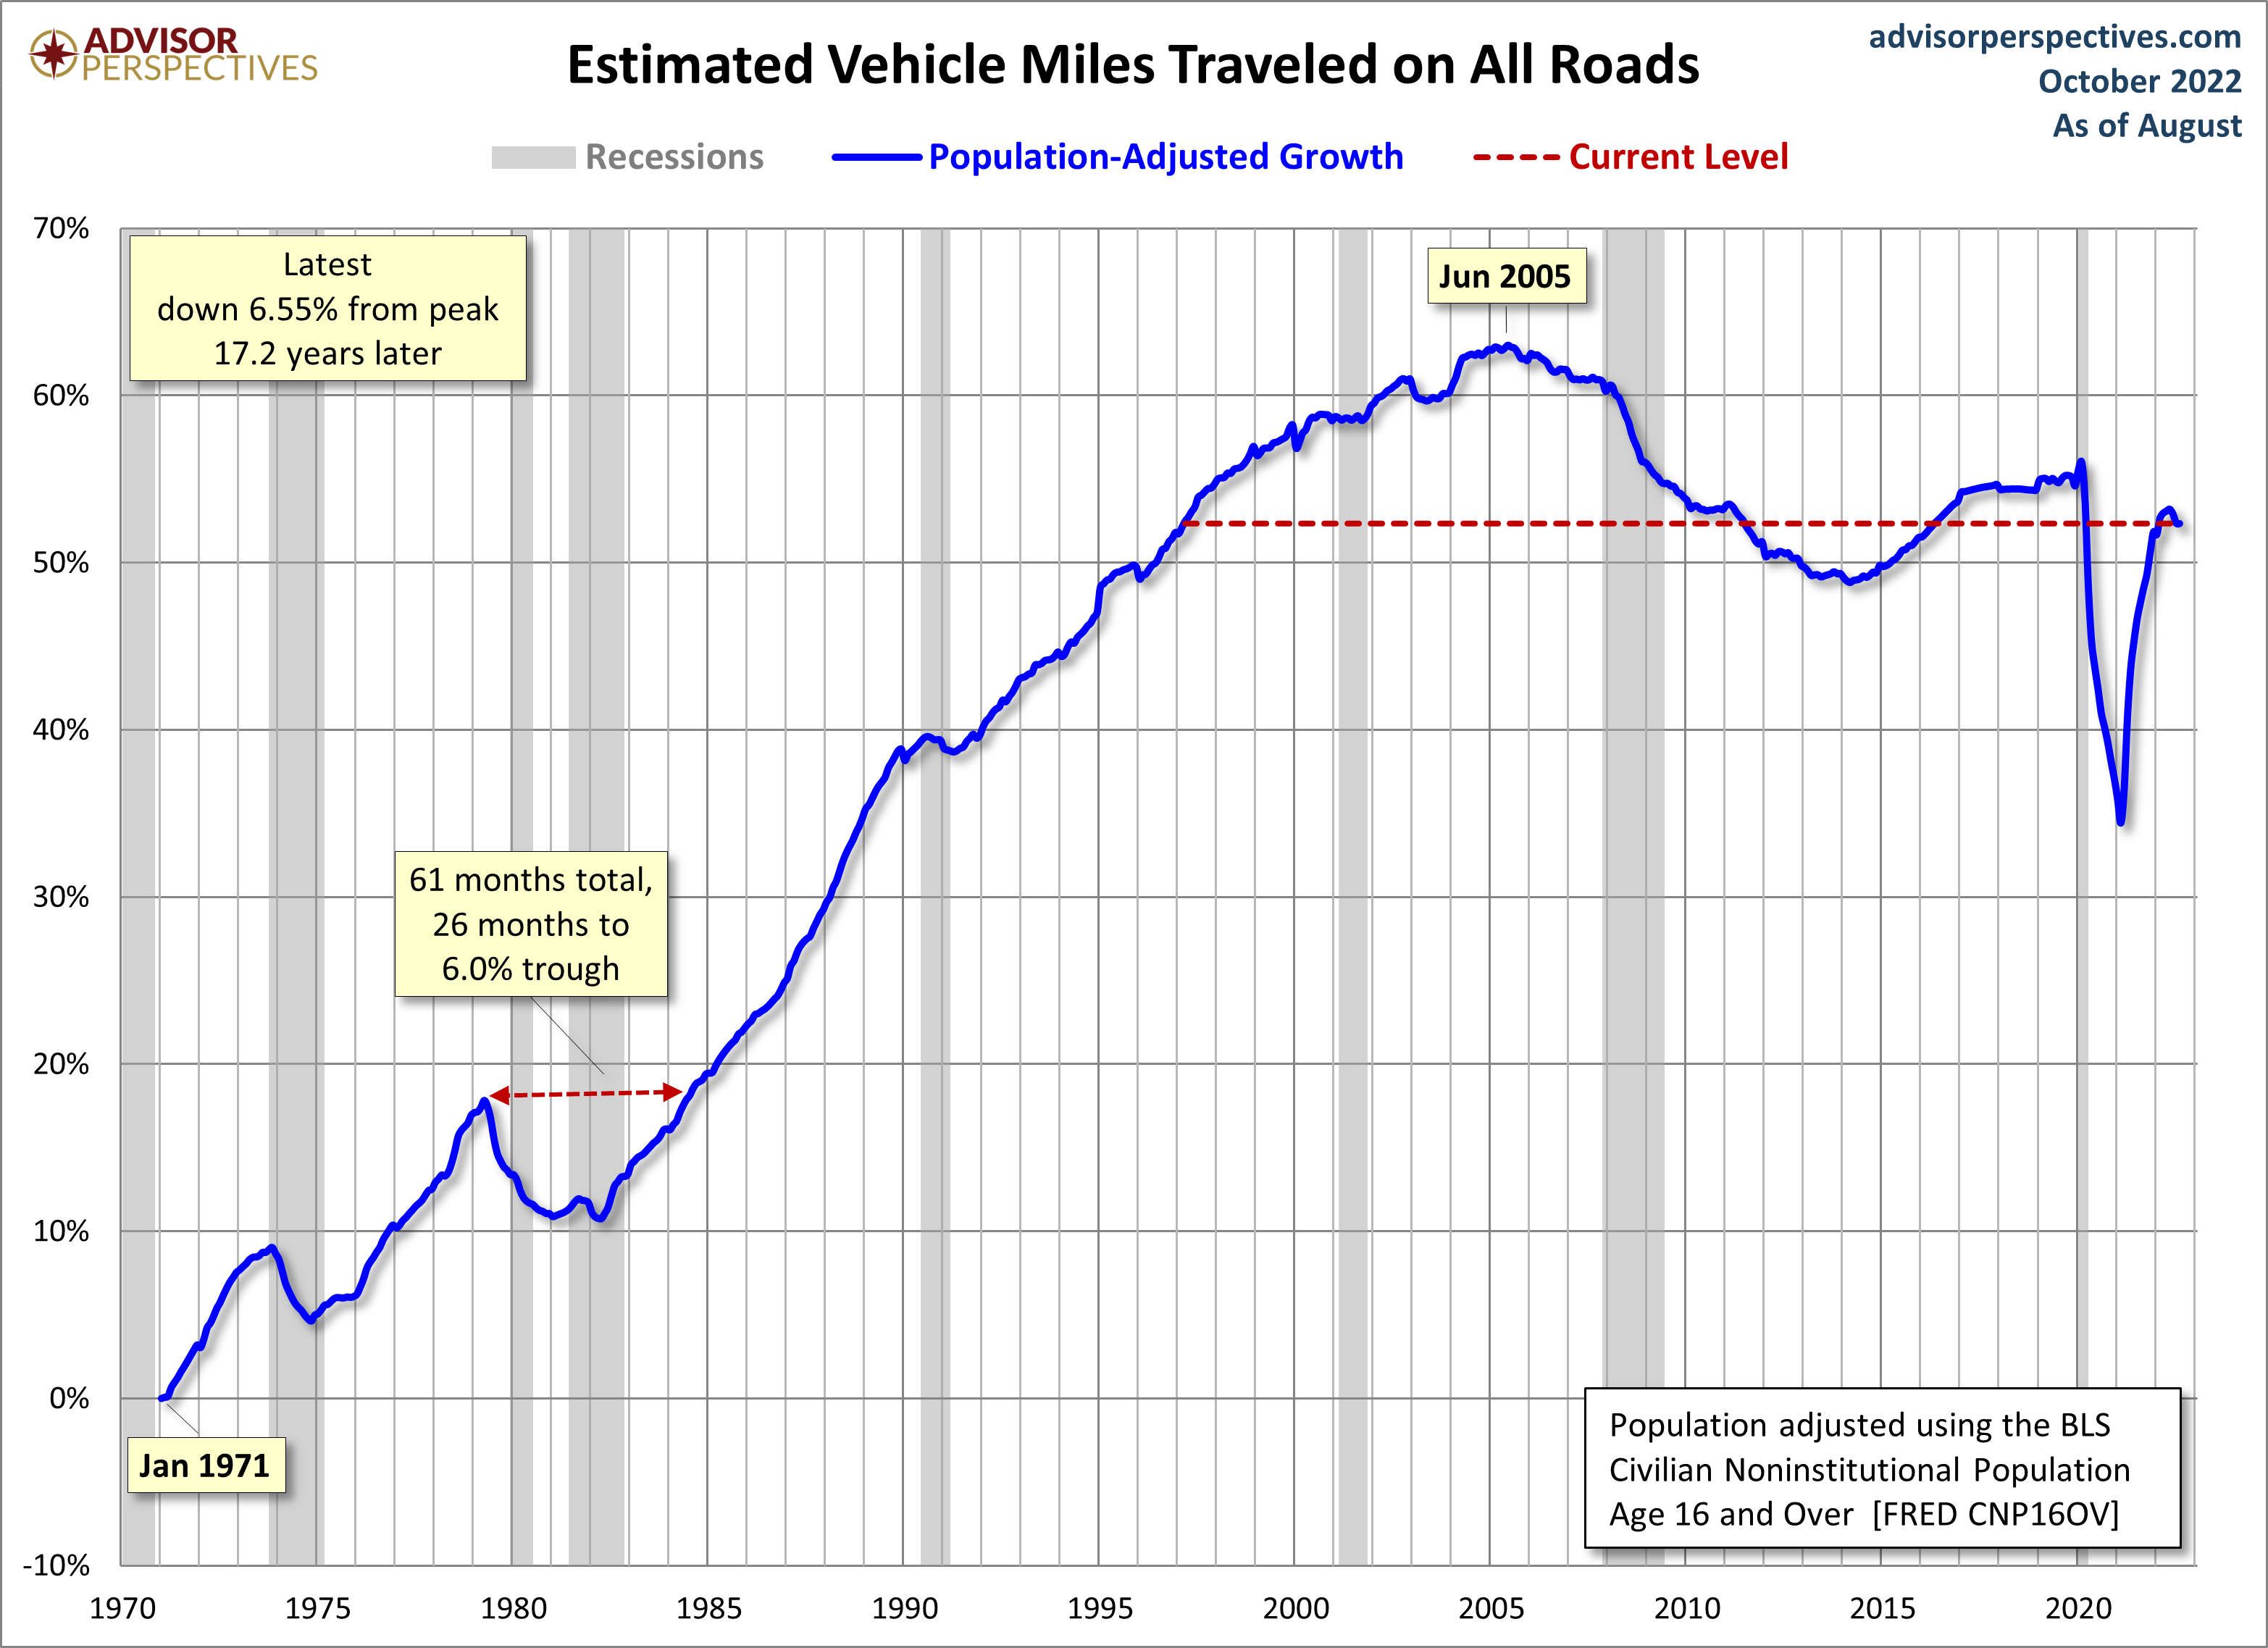
"Travel on all roads and streets changed by +0.7% (+1.9 billion vehicle miles) for August 2022 as compared with August 2021. Travel for the month is estimated to be 289.3 billion vehicle miles." The 12-month moving average was up 0.05% month-over-month and up 4.2% year-over-year. If we factor in population growth, the 12-month MA of the civilian population-adjusted data (age 16-and-over) was down unchanged month-over-month and up 3.2% year-over-year.I was wondering if gas prices would reduce driving and it seems that did, if only slightly. Also, Americans are still not driving as much as they did before the pandemic.
*Speaking of which, there's some speculation that the effects of COVID-19 are also causing cognitive and emotional issues in drivers. I don't know about that, but it's enough to make me examine long COVID soon, if not next. Stay tuned.
No comments:
Post a Comment