The Michigan State Police is joining law enforcement agencies across the state in cracking down on speeding after reporting an alarming rise in speeding and fatalities since the start of the pandemic.I expected something like this, as Paul Krugman linked to 2020 Fatality Data Show Increased Traffic Fatalities During Pandemic in the thread beginning with this tweet.
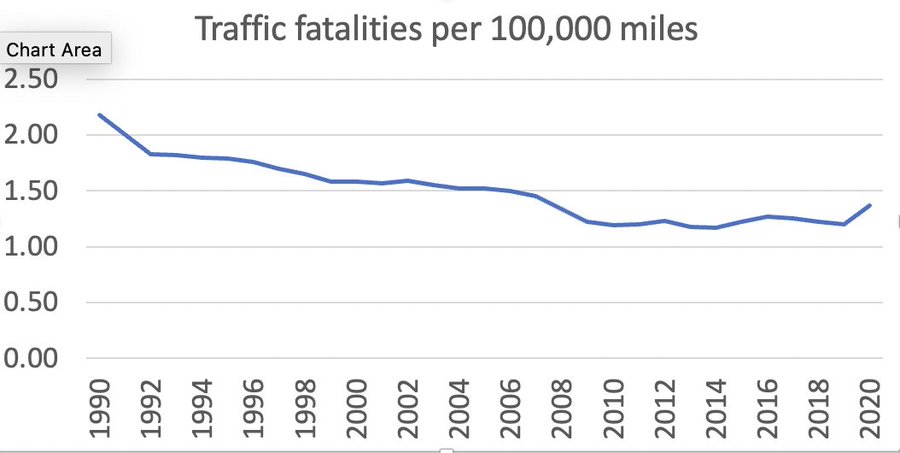
The U.S. Department of Transportation’s National Highway Traffic Safety Administration today released preliminary estimates of crash fatalities in 2020 involving motor vehicle occupants, motorcyclists, and people walking and biking...Krugman also created a chart of traffic fatalities per miles driven from 1990 to 2020.
While Americans drove less in 2020 due to the pandemic, NHTSA’s early estimates show that an estimated 38,680 people died in motor vehicle traffic crashes—the largest projected number of fatalities since 2007. This represents an increase of about 7.2 percent as compared to the 36,096 fatalities reported in 2019. Preliminary data from the Federal Highway Administration (FHWA) shows vehicle miles traveled (VMT) in 2020 decreased by about 430.2 billion miles, or about a 13.2-percent decrease. The fatality rate for 2020 was 1.37 fatalities per 100 million VMT, up from 1.11 fatalities per 100 million VMT in 2019. NHTSA’s analysis shows that the main behaviors that drove this increase include: impaired driving, speeding and failure to wear a seat belt.
“Safety is the top priority for the U.S. Department of Transportation. Loss of life is unacceptable on our nation’s roadways and everyone has a role to play in ensuring that they are safe. We intend to use all available tools to reverse these trends and reduce traffic fatalities and injuries,” said Dr. Steven Cliff, NHTSA’s Acting Administrator. “The President’s American Jobs Plan would provide an additional $19 billion in vital funding to improve road safety for all users, including people walking and biking. It will increase funding for existing safety programs and allow for the creation of new ones, with a goal of saving lives.”
NHTSA’s projections show significant increases in fatalities during the third and fourth quarters of 2020 as compared to the corresponding quarters of 2019. NHTSA will continue to carefully analyze various data sources to understand how the risks to vulnerable road users might have changed during 2020 and the contributing factors for the increase.

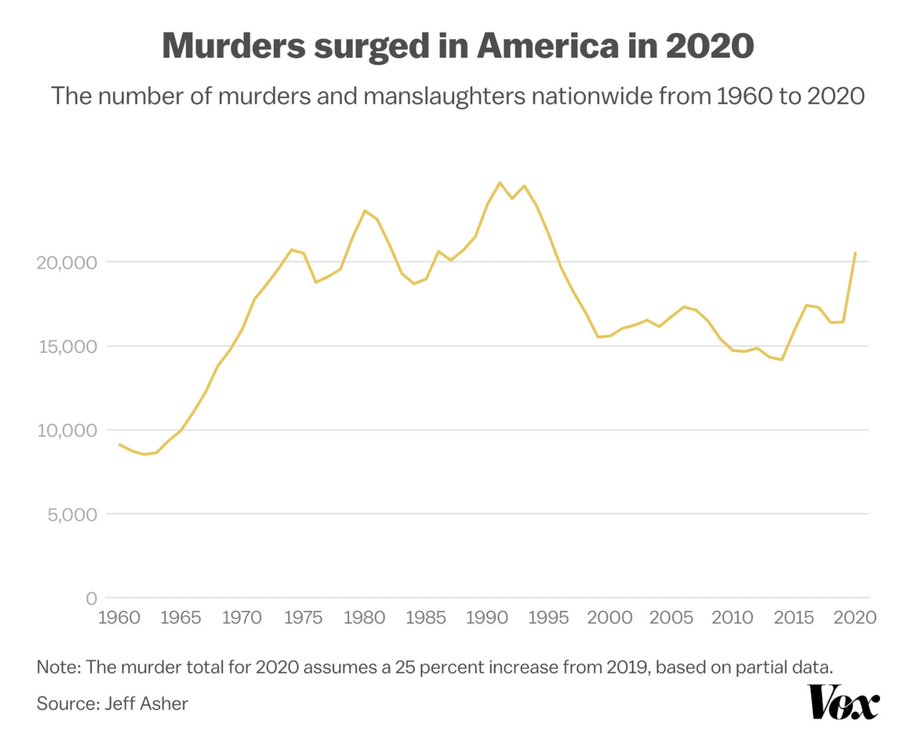
He then compared it to Vox's graph of homicides from 1960 to 2020.

Krugman commented on the parallel between traffic deaths and homicides in the rest of the Twitter thread.
Lots of people blaming Black Lives Matter for the murder surge; good reasons not to buy this, including the fact that red-state cities saw the same surge as blue-state cities. But here's another reason: did BLM cause bad driving? 6/
— Paul Krugman (@paulkrugman) July 24, 2021
My point is that the pandemic and its disruptions seem to have done a number on social psychology in many dimensions. The worrisome thing is that troubled behavior seems to be persisting even as the country reopens. 7/
— Paul Krugman (@paulkrugman) July 24, 2021
In the past week of returning to in-person teaching and resuming my pre-pandemic driving patterns, I've observed several people driving just as Krugman described, weaving in and out of traffic at high speeds. While a few Michigan drivers were doing that all along before the pandemic, I think I've seen more this week than the pre-pandemic average. Based on the data and my personal observations, I agree with Krugman that "the pandemic and its disruptions seem to have done a number on social psychology in many dimensions. The worrisome thing is that troubled behavior seems to be persisting even as the country reopens." Here's to hoping that subsides when the pandemic is over, which it isn't.And back to driving: watching people drive in heavy traffic as if it were last April and nobody else was on the road was pretty hair-raising 8/
— Paul Krugman (@paulkrugman) July 24, 2021
Enough of the big picture. Follow over the jump for the numbers about my personal driving.

Pearl passed 53,000 miles on Tuesday, August 31, 2021. That means it's been 173 days since her odometer rolled over 52,000 miles on Thursday, March 11, 2021, so I drove Pearl an average of 5.78 miles per day, 176.03 miles per standard month, and 2109.83 miles per year since the tenth anniversary of Fukushima triple disaster. That's much more than the 3.88 miles per day, 118.22 miles per standard month, and 1,414.73 miles per standard year I drove her between June 26, 2020 and March 11, 2021, but still less than the 6.62 miles per day, 201.99 miles per standard month, and 2423.84 miles per leap year or 2417.22 miles per standard year I drove Pearl between January 27, 2020 and June 26, 2020.
For the actual miles driven over the past year, I'm dividing 2,000 miles by the 431 days between June 26, 2020 and August 31, 2021, which converts to averages of 4.54 miles per day, 141.53 miles per standard month, and 1,693.74 miles per standard year. That's even less than the 4.89 miles per day, 149.14 miles per standard day, 1,784.84 per standard year and 1,789.73 miles per leap year I drove Pearl between January 27, 2020 and March 11, 2021. For what may be the last time until I retire, I'm writing that I have never driven my primary vehicle so little. I fully expect to be driving her at 4,000+ miles per year when I post the next update, so I'll be adding to the trend of miles driven recovering from the pandemic recession as this graph from Advisor Perspectives shows.

Oh, well, it was nice while it lasted.
No comments:
Post a Comment