
Snow Bear rolled over 5,000 miles on Wednesday, January 16, 2019, so it's time for a driving update.
It has been 84 days since my wife's car passed 4,000 miles on October 24, 2018. That means my wife drove Snow Bear an average of 11.90 miles per day, 363.10 miles per standard month, and 4345.23 miles per year over the past month. That's more than the 10.42 miles per day, 317.71 miles per month, and 3802.08 miles per year she drove her car between July 20, 2018 and October 24, 2018. More of her most recent trip to Chicago ended up in this reporting period, so I'm not surprised.
Of course, the important statistic is how much the two of us drove both our cars combined. Between December 21, 2018, when Pearl passed 44,000 miles and January 16 of this year, I drove her another 300 miles. Since the two cars rolled over their previous thousand miles within a day of each other, that means I drove Pearl 1300 miles in the time my wife drove Snow Bear 1000 miles for a total of 2300 miles in 84 days, a combined average of 27.38 miles per day, 835.12 miles per month, and 9995.05 miles per year. That's less than the 30.93 miles per day, 943.30 miles per month, and 11,288.66 miles per year we drove our cars between July and October, but still more than the 25.42 miles per day, 773.31 miles per month, and 9279.7 miles per year we drove together between March and July. Finally, my wife and I are also driving more than the closest comparable period a year ago, November 22, 2017 to March 25, 2018, when we drove a combined 24.61 miles per day, 750.51 miles per standard month, and 8982.65 miles per year.
We are still contributing to the slow increase in miles driven by Americans last year, as Advisor Perspectives/dshort.com quoting the U.S. Department of Transportation reported earlier this week.
"Travel on all roads and streets changed by +0.3% (+0.8 billion vehicle miles) for November 2018 as compared with November 2017. Travel for the month is estimated to be 258.5 billion vehicle miles." The 12-month moving average was up 0.03% month-over-month and up 0.4% year-over-year. If we factor in population growth, the 12-month MA of the civilian population-adjusted data (age 16-and-over) is down 0.05% month-over-month and down 0.7% year-over-year.
Here is a chart that illustrates this data series from its inception in 1971. It illustrates the "Moving 12-Month Total on ALL Roads," as the DOT terms it.
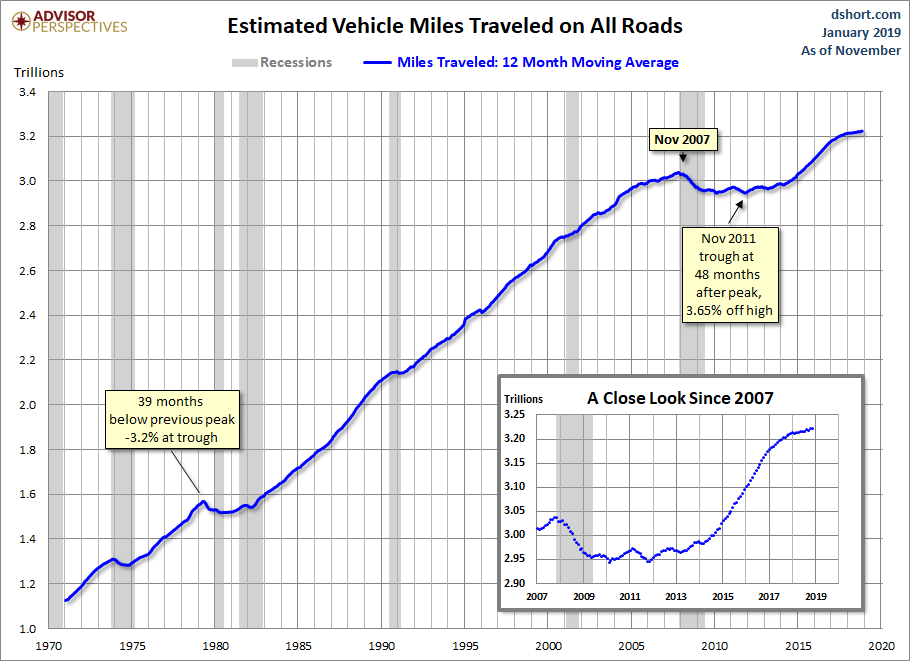
The only good news is that all of the aggregate increase in driving by Americans is from increased population, not the average American driving more. At least our contribution to the twelve months ending November 2018 helped do that.
That's it for this month's driving update. Stay tuned for two days of entertainment features for the holiday weekend.
No comments:
Post a Comment