Showing posts with label Calculated Risk. Show all posts

Tuesday, October 18, 2022

Mark Zandi explains 'What Broke U.S. Recession Indicators' on CNBC

I made the following observation in Wall Street Journal and CNBC explain 'Why a 2022 Recession Would Be Unlike Any Other' this past July.
The GDP numbers may signal a recession, but consumers and possibly even businesses aren't showing signs of it. We may end up having a "Wile E. Coyote moment" where both look down and realize they are over an abyss and then start falling, but that hasn't happened yet.
That still hasn't happened, at least where jobs and inflation are concerned. The result has been that despite GDP declining (slightly) during the first half of 2022, no recession has been declared. CNBC examined this paradoxical situation in What Broke U.S. Recession Indicators | Mark Zandi.

Moody's Analytics' chief economist Mark Zandi cautions that a recession may be on the horizon.

In an interview with CNBC's Andrea Miller, Zandi said a recession did not occur in the first half of this year. Zandi called employment levels the "most important indicator[s]" of a recession. With unemployment at the low rate of 3.5%, he doesn't buy the view that two back-to-back quarters of negative growth alone are sufficient to make for a recession.

But Zandi did warn that he expects layoffs to increase in the days ahead.
I made my forecast of a possible recession in July as well.
I expect it would be like the recession I predicted at the end of 2017 to happen by the end of the last decade, not the one we actually got in 2020 because of the pandemic.
By the way, there won't be a recession called this year for another reason third quarter GDP is estimated to have increased 1.9% to 2.8%. Good news, everyone, but not enough for me to post Professor Farnsworth.

Saturday, April 9, 2022

CNBC explains 'Why Russia’s War Drove Up U.S. Gas Prices'

One of the top posts last year was Trevor Noah and 'The Daily Show' explain why gas prices are so high, so I'm following my usual pattern of following a silly explanation with a serious one. Watch CNBC explain Why Russia’s War Drove Up U.S. Gas Prices.

Gasoline prices rose to record highs in the United States after Russia invaded Ukraine. But the U.S. is the largest oil producer in the world and imports very little petroleum from Russia. So why did prices jump?

Because oil is a global commodity and supply or demand shocks can reverberate around the world. There are also other factors that have made it challenging for oil producers to respond - foreign and domestic U.S. producers have been pulling back production in recent years. A series of boom and bust cycles and the effects of the coronavirus pandemic have drained the industry of qualified personnel and made companies wary of big investments.
That's such a good explanation of oil production, refining, distribution, and markets that I'm tempted to show it to my students, especially since I'm lecturing on energy and mineral resources in my environmental science classes right now and will soon be doing the same in my geology classes. I don't know if I'll have the time. Instead, I'm sharing it with my readers, who I hope learn something from it. I know I did, which was about the mismatch between the oil the U.S. produces and what our refineries require. I did not know that until recently.

By the way, Calculated Risk not only keeps track of the trade deficit, but breaks out the contribution of petroleum and petroleum products to the trade deficit.


For the past two to three years, petroleum has contributed little or none to the trade deficit and actually produced a small surplus during 2020, in contrast to the twenty years before that, where it made up a significant portion of the trade deficit. That's why I'm not as concerned about oil prices causing a recession now as I was in 2001 or 2008 (or will be again by the end of this decade). Then, a lot of the money being spent on petroleum was leaving the country, which will reduce GDP even without decreased economic activity. Enough of that will technically tip the country in to recession. Most of the money being spent on petroleum now stays in the U.S., which won't reduce GDP directly, although it will cause other economic hardships and move enough money around in ways that could cause a recession indirectly. PBS NewsHour updates the effects in U.S. lawmakers grill oil executives about sharp rise in gas prices.

Since Russia’s invasion of Ukraine, fuel prices have shot up and stayed high. Lawmakers on Capitol Hill Wednesday were laying blame for rising gas prices on executives from BP, Chevron, Shell, ExxonMobil and others. Meanwhile, everyday Americans are feeling the pressure. Amna Nawaz reports.
PBS is showing both sides trying to score political points, Democrats against big corporations and Republicans against environmental regulation. It's no surprise that I'm on the Democrats' side on this. However, if CNBC is correct about gasoline and diesel retailers being reluctant about lowering prices at the pump so that they can recoup losses incurred on the way up, then gas station owners are to blame for the continued high cost of fuel. That would mean beating up on local small businesses. I don't think that would play well for either party's politicians, who would rather be seen as defending the public against big business or "big government." That doesn't mean it can't be done. Bill Schuette did exactly that in Michigan ten, nine, and seven years ago. It didn't help him much, as he lost to Gretchen Whitmer for Michigan Governor. That might serve as a bad example that Congress doesn't want to follow, even when both parties are upset about gas prices as they continue to drop.

Follow over the jump for a brief retrospective.

Monday, July 12, 2021

U.S. birth and fertility rates and life expectancy all fell in 2020 for a late World Population Day

A belated World Population Day to my readers! When I decided "Doom in the form of falling birth rates can wait" on Father's Day weekend, I thought today would be a more appropriate occasion to tackle the subject, as I did last year. On that note, I begin by sharing Bill McBride, who wrote U.S. Births decreased in 2020, "Lowest number of births since 1979" in Calculated Risk two months ago.
From the National Center for Health Statistics: Births: Provisional Data for 2020. The NCHS reports:
The provisional number of births for the United States in 2020 was 3,605,201, down 4% from the number in 2019 (3,747,540). This is the sixth consecutive year that the number of births has declined after an increase in 2014, down an average of 2% per year, and the lowest number of births since 1979.

The provisional general fertility rate (GFR) for the United States in 2020 was 55.8 births per 1,000 women aged 15–44, down 4% from the rate in 2019 (58.3), another record low for the nation. From 2014 to 2020, the GFR declined by an average of 2% per year
…
The provisional birth rate for teenagers in 2020 was 15.3 births per 1,000 females aged 15–19, down 8% from 2019 (16.7), reaching another record low for this age group. The rate has declined by 63% since 2007 (41.5), the most recent period of continued decline, and 75% since 1991, the most recent peak.
Here is a long term graph of annual U.S. births through 2020.
VOA News picked up the story two weeks later when it asked COVID Baby Bust? US Birth Rates See Biggest Drop in Nearly 50 Years.

New data show that the birth rate in the United States dropped significantly for every major race and age group during the past year. Experts not only blame uncertainty over coronavirus for part of the decline but also say the U.S. “COVID baby bust” reflects long-running trends in other developed nations. VOA’s Laurel Bowman has that story.
As I wrote about retail, the pandemic has accelerated existing trends in fertility, not caused them.

While McBride and VOA News reported the above in May, the story has continued to make news. Follow over the jump for two more video reports from local TV stations, including Detroit's own WXYZ, plus an update on falling life expectancy.

Thursday, May 27, 2021

CNBC explains how the pandemic disrupted the microchip supply chain for automakers

I suggested today's topic in the footnote to The economics of catalytic converter theft, part 2 of why catalytic converters are being stolen.
Catalytic converters are not the only component of cars to experience a shortage as America recovers from COVID-19; computer chips are, too. I might write about them, as silicon being an important element in auto manufacturing is another story I tell my students. Stay tuned.
CNBC has covered that topic, too. I begin with Why Tiny Microchips Are Crippling The Global Auto Industry And Driving Up Prices from earlier this month.

While the automotive industry was ravaged early on in the pandemic thanks to lockdown measures and a dramatic decrease in travel, it more recently has begun facing a new problem: a shortage of microchips. Microchips are vital to much of a vehicle’s key functions, such as engine control, transmission, infotainment systems, and more.

In the last half of 2020 and now in 2021, vehicle sales recovered fairly quickly, faster than automakers anticipated. Suddenly, they were struggling to meet demand. At the same time, chipmakers were experiencing supply shortages and increased demand from other sectors, such as personal electronics.

With the resulting lack of microchip supply, automakers have been forced to slow production, even on their most popular models. For several automakers, the shortage is expected to cost them $1 billion or more — and even still, the alternatives are worryingly few.
Calculated Risk displayed the crash and rebound of auto sales in April Vehicles Sales increased to 18.51 Million SAAR; Highest Since 2005.


It's easy to see the effect of the pandemic on sales followed by a rapid recovery as lockdowns eased. Still, the shock was enough to break and reforge the links in the microchip supply chain, which CNBC had earlier explained in February's How The Global Computer Chip Shortage Happened.

It’s not an overstatement to say that semiconductors power the modern world. They’re not only a key component of nearly every electronic device we buy and use — they also power the factories that make the electronic devices we buy and use. And now, there aren’t enough of them getting made. Here’s how the global semiconductor chip shortage got so bad, and what’s being done to fix it.

A chip shortage that started as consumers stocked up on personal computers and other electronics during the Covid-19 pandemic now threatens to snarl car production around the world.

GM said that it would extend production cuts in the U.S., Canada, and Mexico until the middle of March. They join a long list of major automakers, including Ford, Honda and Fiat Chrysler, which have warned investors or slowed vehicle production because of the chip shortage.

But it’s not just the automotive industry that’s struggling to get enough semiconductors to build their products. AMD and Qualcomm, which sell chips to most of the top electronics firms, have noted the shortage in recent weeks. Sony blamed the chip shortage for why it’s so hard to get a PlayStation 5 game console.

Chips are likely to remain in short supply in coming months as demand remains higher than ever. The Semiconductor Industry Association said in December that global chip sales would grow 8.4% in 2021 from 2020's total of $433 billion. That’s up from 5.1% growth between 2019 and 2020 -- a notable jump, given how large the absolute numbers are.

Semiconductors are in short supply because of strong demand for electronics, shifting business models in the semiconductor world that created a bottleneck among outsourced chip factories, and effects from the U.S. trade war with China that started under former President Trump.
Ugh, the U.S.-China trade war. I wrote about how it might accelerate the Retail Apocalypse, restrict U.S. access to Chinese rare earths, reduce GDP and increase inflation, trigger a recession, threatened Family Dollar, and cause Dollar Tree to increase prices, but I didn't expect it would show up in this story, yet here it is. This entire story serves as another example of everything is connected to everything else and there is no free lunch; mess with some part of a system and the effects will move through all the connections at rates and sizes ranging from ripples to cascades. In this case, it looked more like a cascade.

Follow over the jump for two videos from CNBC Television reporting on one effort the U.S. government is making to stabilize the microchip supply chain.

Sunday, April 11, 2021

Bill Maher gives the Best Picture nominees at the Oscars two thumbs down for being serious instead of entertaining


I concluded Carbon dioxide at levels not seen for 3.6 million years despite economic slowdown from pandemic by telling my readers "Enough DOOM. Stay tuned for more on the Oscar nominees tomorrow, the Sunday entertainment feature." Once again, I'm featuring something my wife found, New Rule: The Debbies | Real Time with Bill Maher (HBO) in which Bill gets some cheap laughs at Hollywood's expense and demonstrates why he called his old show on ABC "Politically Incorrect."

Bill gives two thumbs down to the trend of virtue-signaling Oscar films.
Bill has a point about the movies the Hollywood creatives in the Motion Picture Academy nominate for awards. They are serious "coffee table" cinema that the entertainment industry wants to show off as serious art. I grew up around these people and they've always been like this, so that's not new. It's just that two trends have made it more apparent this year.

First, the elite and popular tastes have diverged more dramatically this century, so that the last Best Picture winner that was number one at the box office was "The Lord of the Rings: The Return of the King" in 2004 and the last Best Picture winner that was number one at the box office was "Black Panther" in 2019. That they were both speculative fiction films demonstrates that "speculative fiction films have become well-made mainstream entertainment that are also outstanding examples of the movie-making craft, if not great art."

It turns out Hollywood has a business reason for this in addition to an artistic one, to say nothing of snobbery.
“The Oscars aren’t just about the most popular movie,” said Jonathan Kuntz, film historian and lecturer at the U.C.L.A. School of Theater, Film and Television. Instead of mass appeal, the best picture award recognizes intangible qualities such as originality, technical innovation, cultural significance and artistic value.
...
“The Academy Award has always been, since the early days, Hollywood’s way of helping itself in promoting films,” said Mr. Kuntz, explaining why lower-grossing art house films are often favored. “The value of an Oscar to a medium or small film can be great, whereas to a large film, it can be insignificant.”
...
“They want to reward new people and new ideas,” said Mr. Kuntz, which is why best picture rarely goes to reboots or sequels. The first “Star Wars” movie, “A New Hope” (1977), was nominated for best picture, but did not win. The “Star Wars” franchise has enjoyed enormous commercial success since then, but Mr. Kuntz doubted that academy voters would pick a “Star Wars” film for best picture.
...
“The Lord of the Rings: The Return of the King” (2003) is one of the few fantasy movies, and one of few sequels, to win best picture. “In 2001, when the first movie was nominated,” Mr. Kuntz said, “it was considered a major achievement.” He suspects that the reason it took three films for the academy to recognize the trilogy was because of its genre.
So there is a method to Hollywood's madness. I just hope it doesn't backfire.

Second, the pandemic has completely messed up Hollywood's box office and release schedule, so it's almost impossible to really gauge the popularity of movies and a lot of movies that would have been released in theaters ended up delayed, on streaming services, or both, like "Wonder Woman 1984." The following graph from Calculated Risk using Box Office Mojo data shows how the pandemic has caused the domestic box office to crater.


By the way, the uptick at the end of the 2021 series is from "Godzilla vs. Kong," which became the top grossing film so far this year after one week, even though it's also available for subscribers of HBO Max to stream.

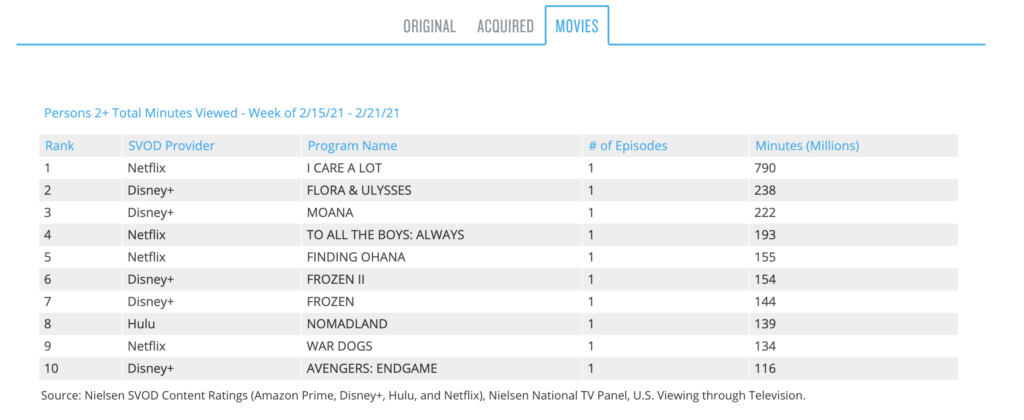
On the other hand, the kind of films that the Motion Picture Academy likes to nominate got released anyway. That made Hollywood's taste for socially conscious Oscar nominees even more prominent this year than in previous years, when there were more popular movies to see in theaters. Just the same, even some of the Oscar nominees have found audiences on streaming, as the following graphic from Cord Cutter News shows.


Yes, "Nomadland," which Bill Maher dumped on, broke into the top ten streaming movies as measured by Nielsen. That's why I think it has a very good shot at winning Best Picture, whether Bill likes it or not. At least we know people, including the Motion Picture Academy members, are watching it.

Finally, Bill mocked the documentaries as the category for serious examination of issues to make people feel bad. As I pointed out in Politics, government, and injustice among the 2021 feature documentary Oscar nominees, while I found little uplifting about "Collective," I thought "Time," "Crip Camp," and "My Octopus Teacher" featured positive stories and "The Mole Agent" to be surprisingly fun. Maybe Bill should watch those for a better movie experience.

That's it for today's entertainment feature. I'll be back tomorrow for Yuri's Night. Stay tuned.

Thursday, July 30, 2020

Auto insurance rebates and lower premiums as Americans drive less, a driving update for Snow Bear during July 2020

Last month, I reported most Americans stay home, allowing people to speed on open roads, when I gave a driving update for Pearl the Prius. Today, I'm sharing a clip from ABC 13 in Grand Rapids, Auto insurance savings due to less driving during pandemic to begin today's driving update for Snow Bear.

Have you received checks in the mail from your auto insurance company? Many are getting refunds, because they didn't drive during the stay at home order.
While some of this report pertains only to Michigan, which recently changed its laws governing auto insurance, some of this should, if it isn't already, apply to the rest of the U.S., as most of us are driving much less.* Bill McBride of Calculated Risk has an update on that story in DOT: Vehicle Miles Driven decreased 26% year-over-year in May
The Department of Transportation (DOT) reported:
Travel on all roads and streets changed by -25.5% (-72.9 billion vehicle miles) for May 2020 as compared with May 2019. Travel for the month is estimated to be 213.2 billion vehicle miles.

The seasonally adjusted vehicle miles traveled for May 2020 is 199.8 billion miles, a -26.1% (-70.6 billion vehicle miles) decline from May 2019. It also represents [a] 24.1% increase (38.8 billion vehicle miles) compared with April 2020.

Cumulative Travel for 2020 changed by -17.3% (-227.2 billion vehicle miles). The cumulative estimate for the year is 1,087.0 billion vehicle miles of travel.

emphasis added
This graph shows the rolling 12 month total vehicle miles driven to remove the seasonal factors.

The drop is even more dramatic in this graph than it was last month. On the other hand, the year-over-year comparison between May 2019 and May 2020 shows that driving is recovering, if still way down from last year.


Both of these graphs show the situation two months ago. For a more up-to-date depiction of how much Americans are driving now, I'm sharing the latest graph of gasoline consumption from the Energy Information Administration in Calculated Risk's High Frequency Indicators for the Economy.


This is what I expect the graph comparing the year-over-year change in monthly driving will look like in two months. Even so, the rolling 12 month total vehicle miles driven will continue to go down for at least the next year, although I expect it will start to bottom out in the second half of 2021. I don't know what it will mean for auto insurance rates yet.

Follow over the jump for more driving math.

Friday, July 24, 2020

CNBC explains why the U.S. faces an eviction crisis

I began the month by posting John Oliver warns of evictions during the pandemic. Since I usually pair a comedic take on an issue with a serious one, it's time to share CNBC's Why The U.S. Faces An Eviction Crisis, uploaded on Wednesday.

Nearly a third of Americans didn't pay their housing costs in July. Now local, state and federal moratoria on evictions originally put in place during the coronavirus pandemic are expiring. While landlords may be sympathetic to tenants needs, communities face hardships when rent goes unpaid. A movement to cancel rent has been growing as the patchwork of solutions across the country leaves many renters falling through the cracks. Watch the video to find out why Americans are facing an eviction crisis.
Watching this hit me personally in a way that the Last Week Tonight clip did not, as the CNBC video reminded me that I was served an eviction notice 13 years ago. Fortunately, my wife and I had already found another place, so we moved, turned in the keys, and then showed up to court to see the eviction motion dismissed. We were the only tenants we attended.

This clip also reminded me of something I had wondered about, which was that defendants in criminal proceedings have the right to an attorney, but defendants in civil proceedings do not. This is one of the reasons that strategic lawsuits and against public participation (SLAPPs) work. People with resources are going after people that may not, making inequality worse. The same is true with evictions, although my parents were landlords and my mom still is, so I can see their side as well.

Sometimes, bad tenants need to go, but becoming unemployed because of the COVID-19 pandemic does not make a person a bad tenant, just an unlucky one. This is particularly true when the apartment might remain empty for months because so many people are out of work.

CNBC had more to say about the eviction crisis two weeks ago in Evictions could hit crisis level—Here's how it's impacting real estate trends.

CNBC's Kelly Evans breaks down the threat of evictions amid coronavirus and trends in the housing sector with CNBC's Diana Olick and Ryan Schneider, CEO of Realogy.
While people at the lower end of the income level are facing loss of housing, it looks like more affluent people are taking the opportunity to move into better housing in the suburbs. If one has to shelter in place, then one might find a better place to find shelter.

Calculated Risk shows this trend in both new home sales...


...and existing home sales, both of which are up from last month.


However, it's new home sales that are up over last year and at a post-crash high, as the people that can afford it want the latest and best that they can afford.


If one is looking for an economic silver lining to the pandemic, here it is. That won't make up for the looming eviction crisis.

Wednesday, June 10, 2020

U.S. is officially in recession

I made a prediction about when the recession would be officially declared in 100,000 dead and 40 million unemployed in the U.S., the human toll of the pandemic so far two weeks ago.
Near the end of February, I wrote "This stock market crash is the one reason I am not revising the recession call I made in CNBC explains how the yield curve predicted every recession for the past 50 years. Without the cornovirus outbreak, I might have to. With it, I still think it's likely." Within a month, I posted FiveThirtyEight examines coronavirus and the economy, by which time the recession was on, even if it won't be declared officially until July.
The NBER surprised me by calling the recession a month earlier than I expected. Yahoo Finance reported that Monday in The U.S. economy is officially in recession, NBER says.

The National Bureau of Economic Research said Monday that the COVID-19 crisis has officially launched the U.S. economy into a recession, thus ending the longest economic expansion on record. Yahoo Finance’s Zack Guzman and Brian Cheung discuss.
Here are the most relevant excerpts from the NBER press release via Calculated Risk.
Cambridge, June 8, 2020 - The Business Cycle Dating Committee of the National Bureau of Economic Research maintains a chronology of the peaks and troughs of U.S. business cycles. The committee has determined that a peak in monthly economic activity occurred in the U.S. economy in February 2020. The peak marks the end of the expansion that began in June 2009 and the beginning of a recession. The expansion lasted 128 months, the longest in the history of U.S. business cycles dating back to 1854. The previous record was held by the business expansion that lasted for 120 months from March 1991 to March 2001.

The committee also determined that a peak in quarterly economic activity occurred in 2019Q4. Note that the monthly peak (February 2020) occurred in a different quarter (2020Q1) than the quarterly peak. The committee determined these peak dates in accord with its long-standing policy of identifying the months and quarters of peak activity separately, without requiring that the monthly peak lie in the same quarter as the quarterly peak. Further comments on the difference between the quarterly and monthly dates are provided below.

A recession is a significant decline in economic activity spread across the economy, normally visible in production, employment, and other indicators. A recession begins when the economy reaches a peak of economic activity and ends when the economy reaches its trough. Between trough and peak, the economy is in an expansion.

Because a recession is a broad contraction of the economy, not confined to one sector, the committee emphasizes economy-wide indicators of economic activity. The committee believes that domestic production and employment are the primary conceptual measures of economic activity.
...
The usual definition of a recession involves a decline in economic activity that lasts more than a few months. However, in deciding whether to identify a recession, the committee weighs the depth of the contraction, its duration, and whether economic activity declined broadly across the economy (the diffusion of the downturn). The committee recognizes that the pandemic and the public health response have resulted in a downturn with different characteristics and dynamics than prior recessions. Nonetheless, it concluded that the unprecedented magnitude of the decline in employment and production, and its broad reach across the entire economy, warrants the designation of this episode as a recession, even if it turns out to be briefer than earlier contractions.
As for my reaction, I'll begin by being a good environmentalist and recycling what I wrote two weeks ago.
While I was right about the timing [of the recession, not the call], I was wrong about the extent of the recession. As I wrote in The tax bill and the U.S. economy in 2018 and beyond, "I expect the next recession to be somewhere between the 2001 recession or the 1990-1991 recession in its effects, probably closer to 2001." Instead, the U.S. is experiencing the highest unemployment since the Great Depression, all within the first two months. Yikes! Now I know how a pandemic or nation-wide natural disaster affects the U.S. economy. I'm not sure I wanted to find out.
The only good thing is that the official recession, the time when the economy as measured by GDP is shrinking, may indeed be brief. For all we know, we may be out of it already. The bad news is that employment may not recover for years, if not a decade. Look at this graph of unemployment during all the post-World-War-II recessions from Calculated Risk and see both where unemployment is now and how long it took for unemployment to recover during all previous recessions, particularly the Great Recession, which is labeled as the "2007 Employment Recession."


Yeah, it could be a while.

Sunday, June 17, 2018

Falling U.S. birth and fertility rates for Father's Day


Happy Father's Day!  Last year, I used Stephen Colbert to mock Alex Jones over his custody battle.  This year, as I wrote  in Life expectancy down for a second consecutive year in the U.S., I am "writing about the lower birth rate for Father's Day," even though that is usually considered a concern of mothers.

The least apprehensive and most thoughtful report I could find on the issue is The surprising thing about the declining U.S. birth rate from PBS NewsHour.

More than 3.8 million babies were born in the U.S. last year, but the birth rate drop was the largest one-year decline since 2010. Why hasn’t the downward trend changed direction, even though economic conditions have improved? Amna Nawaz explores some of the factors with Hans-Peter Kohler of the University of Pennsylvania.
Kohler is the calmest expert I've seen interviewed on this topic.  On the one hand, he's saying that there is no reason to panic just yet, as lots of well-off countries have even lower birth rates, so the U.S. is actually becoming more normal and that we are not yet at levels where low birth rates are a serious economic concern.  On the other hand, birth rates can drop far enough that they will cause problems that social policy can't fix.

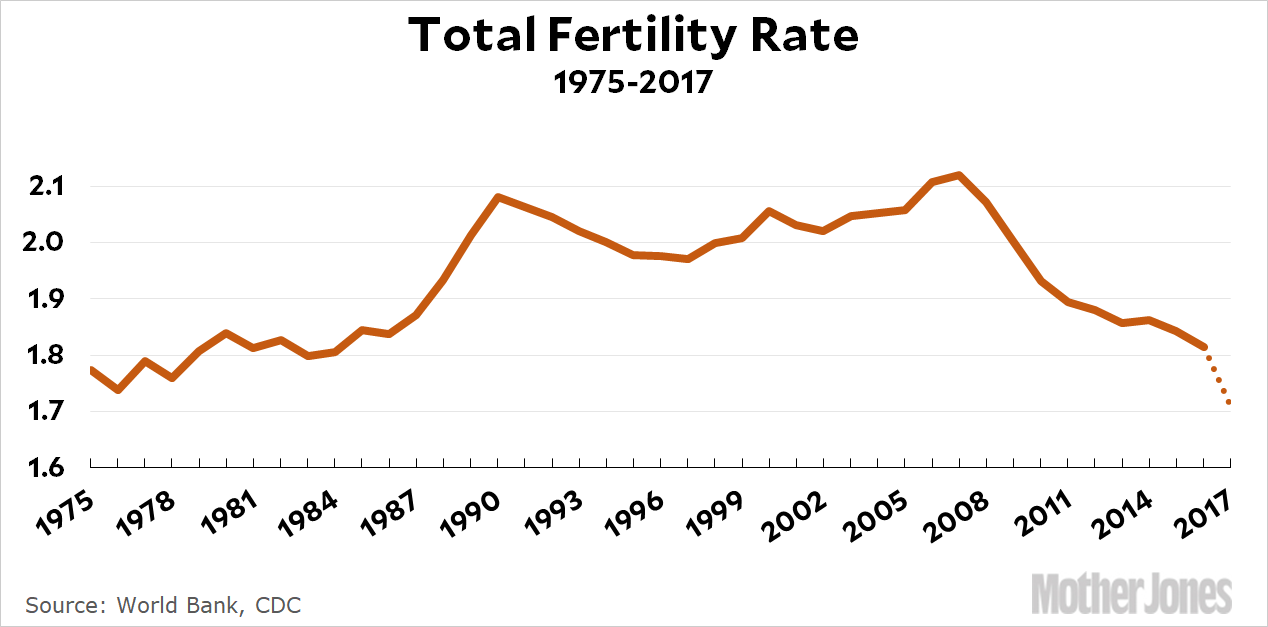
In reality, it's not the birth rates that concern me; the graph above from Calculated Risk shows that, even adding in the drop between 2016 and 2017, total births were lower in 1997, not a time I recall widespread concern about not enough babies in the near future.  It's the fertility rate.  The graph below from Mother Jones shows it at a record low, well below replacement rate.  With an increased death rate and a lower immigration rate, that will cause the population of the U.S. to stop increasing sometime this century.


I have been in favor of zero population growth for as long as I can remember.  However, I'm not sure the U.S. economy is set up for a stable or slowly declining population, a point I made in the Hipcrime Vocab: Why Slowing Population Growth is a Problem.  We are going to have to figure how to do so.  Otherwise, I might live long enough to experience the wisdom of the saying "Be careful what you wish for; you might get it."

Saturday, December 30, 2017

The tax bill and the U.S. economy in 2018 and beyond


Last month I forecast the future of the multi-year increase in miles driven by Americans that "I expect this trend to continue until the next recession, which I'm still predicting will begin next year.  I'll re-evaluate my forecast next month.  Stay tuned."  Not only is next month now this month, it and the year it is part of are already almost over, so it's time for me to follow through before my promise turns into a pumpkin at the stroke of midnight on New Year's Eve.  Revising my economic forecast has become especially important in light of the passage of the tax "reform" bill, which I didn't think I'd include at the start of November.

First, it's time to revise the recession outlook from what I wrote at the end of June.
The lower gas prices, continuing low unemployment rate, and near-record-high stock indices all suggest that the U.S. economy is not headed for recession in the next six months.  I'm delaying my prediction by one Friedman Unit, which is six months, so the deadline for the U.S. heading into recession is now one year from tomorrow [June 30th].  Enjoy the expansion while it lasts.
While gas prices are up year over year and U.S. crude oil closed above $60/barrel for the first time in nearly three years, the unemployment rate is still very low and the Dow Jones Industrial Index is just off the 70th record high of the year.  Along with other factors, it looks like the onset of the next recession is still more than six months off.  Consequently, I'm postponing my call for it to begin for another five or six months, until next November or December.  Since it takes two consecutive quarters (six months) of decreased Gross Domestic Product (GDP) for a recession to be declared, no one will know for certain until July 2019.  Enjoy not officially being in recession for more than a year.

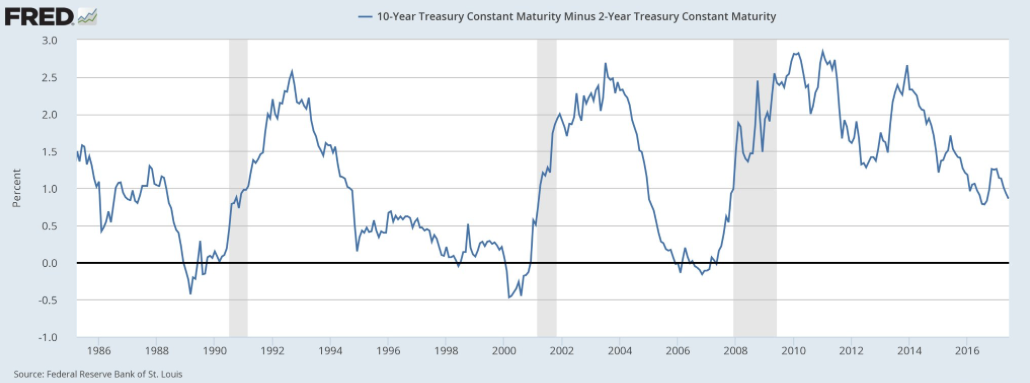
Three things could trigger the next recession.  The most likely would be an inversion of the yield curve, which means that short-term interest rates would rise higher than long-term interest rates.  The Federal Reserve has been raising short-term rates for the past two years while long-term rates have been rising much more slowly.  If present trends continue, short-term rates will rise above long-term ones within a year or two, which always signals a recession within a year.  See the graph below.  When the black line is below zero, the yield curve is inverted.  That is always followed by a gray bar, which marks a recession.


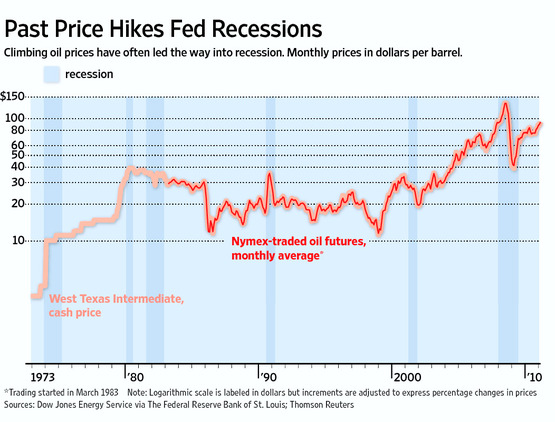
The second is a rapid rise in oil prices, which has occurred either slightly in advance or concurrently with every recession since 1973.  Again, see the chart below, which shows that relationship and in which the shaded bars represent recessions.


The last, which the U.S. saw along with both of the above during the last recession, would be a crash in housing prices.  However, that is not as reliable an indicator of contraction, as it took nearly two years between the bursting of the housing bubble and the onset of the Great Recession of 2008-2009, barely happened before the recession of 1990-1991, and it didn't happen at all before the 2001 recession, all of which the graph below shows.


Keep all three of these in mind when I analyze the effect of the tax bill on the economy.

Before I do, I want my readers to notice the timing of recessions.  They range from seven (2001 to 2008) to eleven years (1990 to 2001) apart.  That range is exactly consistent with the Juglar Cycle, an economic cycle that lasts seven to eleven years, the downturns of which correlate to U.S. recessions since 1980.  The Great Recession technically began in December 2007 and adding eleven years to that means the next one should start no later than December 2018.  We're due.

Saturday, November 12, 2016

Double driving update for November 2016


Both cars turned over their odometers this week, so its time for a double driving update, just like the one I wrote for September.  Pearl passed 30,000 miles on Tuesday and Dez passed 53,000 miles on Wednesday.  After doing the calculations, Dez's odometer showed 52,000 miles on September 19, while Pearl's was at 29,000 on September 21 (happy birthday to me!)  Those mean that it took me 41 days for me to drive Pearl 1,000 miles and my wife 44 days to drive Dez the same distance.   That means I drove 24.39 miles/day and 743.90 miles/standard month while my wife traveled 22.73 miles/day and 693.18 miles/standard month over the past seven weeks.  Combined, we drove our cars 47.12 miles/day and 1437.08 miles/standard month since the last update.  Those are a lot more than the 17.54 miles per day and 535.1 (535.09) miles per standard month for Pearl, 6.90 miles per day and 210.34 miles per standard month for Dez, and combined 24.93 miles per day and 760.4 miles per standard month from September.  I drove as much during the past month-and-one-half as both of us drove during the previous two months!

So what changed?  I performed a lot of volunteering for the election, canvassing for candidates and dropping off lawn signs.  My wife visited our daughter in Chicago.  As long as gas is relatively cheap, we can afford to do things that are as high a priority as sustainability, such as family and politics.  The good news for our gas consumption is that the election is over and our daughter and her dogs will visit us for Thanksgiving.  In addition, I'll have fewer meetings to attend.  All that should reduce our driving considerably for the rest of the year, possibly even back to normal, which would be at or below 1,000 miles per month for both cars.

Our increased driving puts us in good company, as the Department of Transportation reported last month.
  • Travel on all roads and streets changed by 3.4% (9.3 billion vehicle miles) for August 2016 as compared with August 2015.
  • Travel for the month is estimated to be 284.9 billion vehicle miles.
  • The seasonally adjusted vehicle miles traveled for August 2016 is 268.6 billion miles, a 2.5% (6.5 billion vehicle miles) increase over August 2015. It also represents a 0.8% decrease (-2.2 billion vehicle miles) compared with July 2016.
  • Cumulative Travel for 2016 changed by 3.1% (65.3 billion vehicle miles).
  • The cumulative estimate for the year is 2,152.4 billion vehicle miles of travel.
Calculated Risk displayed the data showing the increased miles driven for all Americans.


True, we actually did not contribute to the higher miles driven during August, as we actually drove less this August than last August, as I reported in Pearl's driving update for December 2015, but I'm sure we'll add to the increased driving for September through November.

Stay tuned for the Sunday entertainment entry.  Leave a comment here or surf over the the blog's Facebook page to vote for the topic of tomorrow's entry.  The choices are box office and reviews for the opening weekends of "Arrival" and "Fantastic Beasts and Where to Find Them" and how they compare to "Doctor Strange," more on "Westworld," trailers for "Rogue One" and "Wonder Woman," marches for the winners of the Electoral College and the popular vote, or write-in votes for any other entertainment topic (ETA: such as the death of Leonard Cohen, whose music I've used twice).  I count those, as last Sunday's entry shows.  That was decided by one person.  It could be you.

Wednesday, October 5, 2016

Supply and demand still work for oil

One of the phenomena that convinced me that Peak Oil was real was not just that oil prices shot up as oil production plateaued in the early 2000s, but also the very long delay between those high prices and new supply coming on to the market.  It was that latter apparent failure of the classical economic story of supply and demand working that made me realize that the world might have hit Hubbert's Peak between 2005 and 2008, exactly as predicted by some of the experts in "The End of Suburbia."  That, and some of the other predictions, particularly Kenneth Deffeyes "list of things"--"seven trillion dollars lost out of the U.S. stock market, two million jobs lost in the United States, federal budget surplus - gone, state budget surpluses - gone, the middle class disappearing"--were what also persuaded me to show the movie to my students.

However, the past two years have made me realize that Hubbert's Peak may have passed for conventional oil only, not for all oil.  Supply finally caught up with and passed demand, causing oil prices to fall, both of which fit the predictions of mainstream economics.  Too see both the increased supply and the lower price, first look at this graph of world oil production from Econbrowser.  The blue line shows the period of the "bumpy plateau" that looked like the one predicted from Peak Oil theory.


Compare with this graph showing the price of West Texas Intermediate (WTI) and Brent Crude from Calculated Risk.


That bump in production above the blue line during the past three years coincides with the drop in price.  That's the good news out of all this.

The bad news is the other side of supply and demand.  When prices fall, supply eventually falls as well.  I've been expecting that to happen since December 2014.  The graph below from Econbrowser shows that it has happened, at least for the U.S.


As a result, U.S. and world production is falling again, so the prices have resumed rising.  Calculated Risk's graph of year-over-year oil prices shows that prices are actually slightly up from a year ago for the first time in more than two years.


The result at ground level is that the downward seasonal pressure on gas prices at the pump is being counteracted by upward pressure from wholesale prices.  I saw that yesterday, when I filled up at one of the stations in my old neighborhood, which was selling regular at $2.27.  Two weeks ago, it was selling regular for $2.10.  The first time I visited the station in August, I bought regular for $2.09.  That's a graph of slightly increasing prices when the usual trend is for falling ones.  Fortunately, prices are still relatively low and I drive a Prius, so I'm not complaining in earnest, as it could be and has been a lot worse.

Another result of the oil price drop that I feared would be financial chaos from the shale oil bubble bursting wiping out the gains to the consumer economy from lower energy prices.  That didn't happen, but trouble with shale oil did counteract the improved situation for the consumer, as this graph from Econbrowser shows.


GDP improved from lower oil prices, but only 0.12% worth.  James Hamilton explained the situation thus.
But gains to consumer spending were mostly offset by a drop in oil-related investment spending. Nonresidential fixed investment had been growing at a 4.3% rate prior to the oil-price drop but has only increased at a 0.8% annual rate since, due to a 50% drop in investment spending in the oil sector.

The U.S. imports 6 million more barrels of crude petroleum and refined products than it exports every day. Between June 2014 and March 2016 the real price of oil declined by 68%. As a net oil importer, the fact that Iraq and Iran are now willing to sell us more oil at a lower price should be good news for the U.S. economy. In idealized economic models, the resources that had been producing oil should now shift to producing other goods, and with the new terms of trade we should as a result be even more productive than before.

But in the real world shifting resources is easier said than done. We now have a large stock of capital that was being used to develop U.S. shale oil, and contrary to the predictions of simple economic models, there is not some other more productive place to use that equipment.
As for my prediction of a recession starting sometime in 2017, I'm even more confident than before.  Now that oil prices are rising, the possibility of an oil-price-shock has increased, especially with this news from Bloomberg: OPEC Agrees to First Oil Output Cut in Eight Years.  If OPEC succeeds in getting Saudi Arabia, Iran, and Iraq on the same page on this, further price increases are inevitable.  If they exceed 50% in one year, so is the oil-price-shock recession.

Monday, June 6, 2016

Good news, bad news from jobs report


Last month, I showed the above graph showing the relationship between education and unemployment to my students* and I pointed out out to them that the recent pattern of a spike in unemployment for those with less than a high school diploma along with a flattening of unemployment for high school and college graduates looked a lot like the period right during late 2006 and early 2007, a year or less out from the onset of the Great Recession in December 2007.  I then repeated my prediction that I first made in 2014, updated twice in 2015, and twice early this year of a recession beginning late this year or early next year and no later than the end of 2017.  They gasped in apprehension at the prospect.

Friday, news came that gave a little more confidence in that prediction, the May Employment Report: 38,000 Jobs, 4.7% Unemployment Rate.  The good news was that unemployment fell.  In addition to the headline rate dropping, it fell among all educational classes with Jobsanger reporting the following:
Less than HS diploma...............7.1%
HS graduate...............5.1%
Some college...............3.9%
Bachelor's degree or more...............2.4%
All of those are at record post-recession lows except for those with less than a high school diploma.  Those are still above the post-recession low of 6.8% in December 2015, which is consistent with the pattern.  Even convincing so was the low number of jobs created along with the high number of people leaving the labor force.  That looks like the kind of change in the labor market that would happen in advance of a recession.

Now, the r-word didn't pass the lips of the reporters from the Wall Street Journal in Hilsenrath: What Jobs Report Means for the Fed, but other worries certainly did.

The U.S. added only 38,000 new jobs in May, the slowest pace since September 2010. How will the report be interpreted by the Federal Reserve? WSJ's Jon Hilsenrath discusses with Tanya Rivero.
The jobs report had a lot of other outlets worried, too.  FiveThirtyEight posted Hiring Really Is Slowing Down.  Vox published The economy just got its worst job report in years.  New York Magazine connected the poor economic performance to the election in Hillary Clinton Should Be Worried About This Lousy Jobs Report.  Yes, she should, but only if it persists.  After all, she is still leading Trump and Johnson in Michigan, Trump is attacking the judge in his case while his supporters were getting beat up in San Jose, and Clinton beat up on Trump's lack of foreign policy experience, among other things.  Last week was not a good one for Trump.

The people who aren't panicking are the economic bloggers, although they aren't happy about them, either.  Bill McBride called it disappointing, but pointed out that this has happened in the middle of expansions before, then repeated his prediction of 2 million new jobs by the end of the year.  New Deal Democrat over at the Bonddad Blog described the pattern as pre-recessionary, bragged a bit that he had been calling for something like this to happen beginning a year ago, but then said to expect "more reports of 1xx,000 to come. But at the same time, it is nowhere near as negative as it has been in the past at the onset of recessions."  In his next entry, he then reassured his readers "Despite the punk jobs report, the high frequency data is almost all positive or neutral.  There are very few negatives."  I'm with him.  I don't expect a recession to hit until next year now.

*If they look familiar, it's because I posted earlier versions in 2011 and 2015.  Despite the fulminations of Greer and Kunstler, the positive relationship between education and employment still holds.

Saturday, April 30, 2016

Dez's turn for an April driving update plus bonus gas prices

Dez turned over 51,000 miles on Wednesday April 27th, exactly six weeks after she passed 50,000 miles on March 16th.  That puts it right on the schedule I expected in this month's update for Pearl when I wrote I'll see how much the household is adding to the total when I update Dez at the end of the month."  That means my wife and I drove her car an average of 23.81 miles per day or 726.2 miles per standard month.  That's a lot more than the 9.9 miles/per day or 302.0 (301.98) miles per standard month we drove it between December and March and even more than the 16.67 miles per day or 508.33 miles per standard month we drove the car between October and December.  What increased the mileage so dramatically?  Simple--my wife took the car in for service, then drove to see our daughter in Chicago.  As I wrote in December, "sustainability is a priority, but so is family, and driving while gas is cheap makes keeping in touch more practical."

Combined with the 17.86 miles per day or 544.6 miles per standard month I drove Pearl this month, my wife and I drove a total average of 40.48 miles per day and 1270.8 miles per month.  WOW!  For once, we really are contributing to the trend of increased driving by Americans, as shown by this graph from Doug Short.

"Travel on all roads and streets changed by 5.6% (12.4 billion vehicle miles) for February 2016 as compared with February 2015." The less volatile 12-month moving average was up 0.39% month-over-month and 3.0% year-over-year.
As for what the immediate future holds, expect less driving for Pearl over the summer as I have fewer meetings to attend, I drive to only the nearest campus to teach, and I walk more as the weather improves.  That the sidewalk has been extended on the way to the nearest store will help, as does my having a Fitbit.  Nothing like monitoring my activity to induce me to walk more.

Dez will probably be more in line with the 16.67 miles per day or 508.33 miles per standard month she logged between October and December.  Consequently, the family will drive a little less next time.

Follow over the jump for the gas price report.

Saturday, April 16, 2016

Driving update for April 2016: Pearl plus bonus gas price report


I noted that "Pearl turned over another 1000 miles yesterday, so a post about that is still on tap for Saturday" in Climate for the fifth year of Crazy Eddie's Motie News.  It's now Saturday, so it's time to update my driving diary, which is one of the ways I monitor my consumption.

Pearl the Prius turned over 26,000 miles on Wednesday the 13th, exactly eight weeks or 56 days since she passed 25,000 miles on Wednesday February 17th.  That translates into 17.86 miles per day or 544.6 miles per standard month.  That's more than the 15.87 miles/day and 484.13 miles/month I drove her between December and February, but more in line with the 17.54 miles/day and 535.09 miles/standard month I drove her between October and December.  Again, I returned to work, complete with all the driving to meetings.  In fact, I'm surprised I didn't drive much more, as I now have two more meetings per month to attend.*  Even so, I'm still adding to the increase in miles driven as reported by the U.S. Department of Transportation as quoted by Calculated Risk: DOT: Vehicle Miles Driven increased 2.0% year-over-year in January.
The Department of Transportation (DOT) reported today:
Travel on all roads and streets changed by 2.0% (4.8 billion vehicle miles) for January 2016 as compared with January 2015.

Travel for the month is estimated to be 240.7 billion vehicle miles.

The seasonally adjusted vehicle miles traveled for January 2016 is 264.3 billion miles, a 2.7% (7.0 billion vehicle miles) increase over January 2015. It also represents a -0.8% change (-2.1 billion vehicle miles) compared with December 2015.
The following graph shows the rolling 12 month total vehicle miles driven to remove the seasonal factors.

The rolling 12 month total is moving up - mostly due to lower gasoline prices - after moving sideways for several years.

I'll see how much the household is adding to the total when I update Dez at the end of the month.

Speaking of lower gas prices, follow over the jump for the latest on them.

Friday, March 18, 2016

Driving update for March 2016: Dez plus bonus gas price update


After observing that Americans are driving more in Driving update for February 2016: Pearl, I wrote that I'd wait to see if both drivers in the family were contributing:
I'll see if my wife is reinforcing the trend or bucking it when I report on Dez later this month or sometime in March.
My wife's car Dez rolled over 50,000 miles on Wednesday, March 16.  She even sent me a text with a screenshot of the odometer at 50,001 miles, which inspired my choice of illustration for this entry.  How sweet!

Dez passed 49,000 on December 6, which was 101 days earlier.  That translates into 9.9 miles/per day or 302.0 (301.98) miles per standard month.   It's a lot less than the 16.67 miles per day or 508.33 miles per standard month we drove the car between October and December, but only slightl more than both the 9.71 miles/day and 296.1 miles/standard month my wife and I drove the car between June and October.  The difference?  My wife hasn't driven to Chicago to see our daughter yet this year, cutting down her driving.  She's not the one in the family contributing to the nation driving more.

Speaking of which, Bill McBride of Calculated Risk wrote last month that Vehicle Miles Driven increased 4.2% year-over-year in December.
Travel on all roads and streets changed by 4.2% (10.6 billion vehicle miles) for December 2015 as compared with December 2014.

Travel for the month is estimated to be 264.2 billion vehicle miles.

The seasonally adjusted vehicle miles traveled for December 2015 is 268.5 billion miles, a 4.0% (10.4 billion vehicle miles) increase over December 2014. It also represents a 1.4% change (3.7 billion vehicle miles) compared with November 2015.
Here's the relevant graph.


Of course, the important statistic is how much we are driving our cars.  The last time I estimated our combined mileage was in the Driving update for December 2015: Pearl.  Then, we drove a combined average of 34.21 miles/day and 1043.42 miles/month.  This time, I'm combining Dez's 9.9 miles/per day or 302.0 (301.98) miles per month with Pearl's 15.87 miles/day and 484.13 miles/month to total 25.77 miles/day and 786.11 miles/month.  That's much less than in December and even less than August's 26.95 miles/day and 822.0 miles/month.  We are definitely doing our part to counteract the trend!

Follow over the jump for the gas price update.

Thursday, February 18, 2016

Driving update for February 2016: Pearl


Pearl the Prius's turned over exactly 25,000 miles as I drove the final block to my house yesterday evening, so it's time for another driving update.

Pearl turned over 24,000 miles 63 days (nine weeks) ago, so I've driven her an average of 15.87 miles/day and 484.13 miles/month since then.  That's almost two miles per day and 51 miles/month less than the 17.54 miles/day and 535.09 miles/standard month I drove her between October and December.  Yay, I drove less!  That's because I was off from work for three weeks and out of town for nine days.  That's why I posted all those student sustainability videos the first week of January.  I could program a bunch of short entries to post while I was traveling and no one would be the wiser.*  Honestly, I thought that my average would be even less.  After all, I drove Ruby 15.15 miles/day and 462.1 miles/month between January and March last year, and that didn't include a three-week break!  I blame adding two additional meetings a week to my schedule for my increased driving.  I'm sure the full effect will show up in the April report.

Follow over the jump for some context from Calculated Risk and Toyota's Super Bowl commericial for the Prius.

Thursday, January 14, 2016

Oil falls to 12-year lows, dragging stocks down with it


I bragged about a forecast that came true in Michigan has the cheapest gas in the U.S.
I opened Regular falls below $2.00 in metro Detroit before Thanksgiving as predicted by forecasting that gas would fall to $1.75 by Christmas, either as the average price in my old neighborhood as as the Detroit average from GasBuddy.  The first happened this weekend as the price in my old neighborhood was $1.69 at all three stations on Tuesday.  The second nearly happened, as the average was $1.79 Tuesday morning and is $1.78 now.  I'll claim credit for being right 23 days early.
I ended with a weak prediction that "Limbo Kitty might be getting quite a workout this winter."  So far, that hasn't happened, at least for gasoline, as the cheapest I've seen the stations in my old neighborhood since was $1.73 on Tuesday when I filled up Pearl, and the Detroit average never quite hit $1.75.  Oil prices, however, have been another story, as Reuters reported yesterday morning in Oil's slide below $30 sends shockwaves far and wide.
U.S. oil stumbled below $30 for the first time in 12 years to levels that threaten the survival of many U.S. shale firms, spur more belt-tightening by oil majors and spell more pain for crude-producing nations and regions.

A seven-day losing streak fueled by concerns about a continued supply glut and fragile demand from China, the world's No. 2 consumer, wiped out almost a fifth of crude prices this year and 70 percent since mid-2014.

Traders have all but given up attempting to predict where the new-year rout will end, with momentum-driven dealing and overwhelmingly bearish sentiment engulfing the market. Some analysts warned of $20 a barrel; Standard Chartered said fund selling may not relent until it reaches $10.
$10-$20 oil?  That's the range in which the investment strategy of Mike Alexander's that I mocked in the footnote to Two years on, the stock markets are still setting records will work.
In 2003, he thought oil would return to 1998 levels within a decade and devised an investment scheme based on that prediction.  I told him that would never happen and that he shouldn't include that in his next book.  His response was that it only had to work once.  I told it would only work once if he was lucky.  After a dozen years, I'm still right; oil prices never dropped that low again.
It might just happen in the next year.  If so, I can still say I was right.*

Enough bragging.  How low did oil go on Tuesday?
The U.S. West Texas Intermediate crude (WTI) benchmark briefly touched a low of $29.93, which was last seen in December 2003.
Yowza!  I never thought I'd see prices that low again, not unless the U.S. was in a deep recession, which were aren't--yet.

What about Wednesday?  Follow over the jump for yesterday's closes.

Tuesday, December 8, 2015

Driving update for December: Dez

My wife and I rolled Dez's odometer over 49,000 miles on Sunday, so it's time for the driving update I promised in the final footnote of Fiat Chrysler uses the power of The Force to sell cars.

Dez the VW rolled over 48,000 miles on October 8th, exactly 60 days earlier.  That means she drove an average of 16.67 miles per day or 508.33 miles per standard month.  That's more than both the 9.71 miles/day and 296.1 miles/standard month my wife and I drove the car between June and October and the 12.99 miles per day and 396.10 miles per standard month we did between April to June.  It's even slightly more than the 16.39 miles per day and exactly 500 miles per standard month from February to April when we drove to Mount Pleasant.  What changed?

My wife drove to Chicago and back to visit our daughter.  That will probably happen at least once every report, so expect our miles driven to stay high from now on.  Sustainability is a priority, but so is family, and driving while gas is cheap makes keeping in touch more practical.

We are in good company in driving more.  Bill McBride of Calculated Risk reported last month that Vehicle Miles Driven increased 2.3% year-over-year in August, Rolling 12 Months at All Time High.
The Department of Transportation (DOT) reported:
Travel on all roads and streets changed by 2.3% (6.3 billion vehicle miles) for August 2015 as compared with August 2014.

Travel for the month is estimated to be 277.3 billion vehicle miles.

?The seasonally adjusted vehicle miles traveled for August 2015 is 263.3 billion miles, a 3.6% (9.1 billion vehicle miles) increase over August 2014. It also represents a -0.4% change (-1.2 billion vehicle miles) compared with July 2015.
The following graph shows the rolling 12 month total vehicle miles driven to remove the seasonal factors.

As for Pearl's next driving update, that could happen later this month or early next month.  Stay tuned.

Thursday, October 8, 2015

Driving update for October: Dez

My wife will roll Dez's odometer past 48,000 miles today, so it's time for the next driving update.  The previous update reported that Dez rolled over 47,000 miles on June 27, 2015.  That was 103 days ago, so my wife and I drove Dez an average of 9.71 miles/day and 296.1 miles/standard month during this time.  This is a lot less than the 12.99 miles per day and 396.10 miles per standard month we did between April and June of this year, which included part of a return trip from Mount Pleasant.  The closest comparable period was from November to February, when we drove the car 11.63 miles/day or 354.7 miles/month.  In fact, it's the least we've driven Dez since we bought it.  It's also very similar to the 9.62 miles/day and 293.27 miles/month we drove Ruby during May to September of last year.  It appears that the higher baseline since we moved to a more car-dependent neighborhood may not be as high as I expected, at least for Dez.  Pearl's driving may be another story.  Expect a driving update for her later this month.

It turns out that my wife and I contributed less to the continuing trend to drive more.  Bill McBride of Calculated Risk passed on the following from the Department of Transporation.
Travel on all roads and streets changed by 4.2% (11.4 billion vehicle miles) for July 2015 as compared with July 2014.

Travel for the month is estimated to be 283.7 billion vehicle miles.

The seasonally adjusted vehicle miles traveled for July 2015 is 264.4 billion miles, a 3.9% (9.9 billion vehicle miles) increase over July 2014. It also represents a 0.8% change (2.1 billion vehicle miles) compared with June 2015.
Here's the graph showing the rapid increase in miles driven over the past year.


McBride attributes most of this increase to cheaper gasoline.  I agree.

That written, local gas prices are about to become less cheap.  I'll have a report on that later.  Stay tuned.