Showing posts with label more. Show all posts

Wednesday, May 21, 2025

BBC News asks 'Will Bluesky be able to rival X or Twitter?' A Wayback Wednesday special

Happy Wayback Wednesday! I'm continuing my retrospectives about the 2024-2025 blogging year with another roundup of the popular posts on social media, this time on Bluesky and Twitter/X. Before I do, I'm sharing BBC News asking Will Bluesky be able to rival X or Twitter?

You may have seen the word "Bluesky" popping up on your social media pages.

It is an alternative platform to Elon Musk's X and the company said it is growing rapidly with users and new sign-ups.

So, what is it and why are so many people reportedly joining?
While BBC's subject line asked about Twitter/X, Bluesky CEO Jay Graber compared herself and her running of Bluesky to Mark Zuckerberg of Meta. I plan on getting to Zuckerberg and Meta's legal fight with the Federal Trade Commission (FTC) on Flashback Friday, when I finish this series with the blog's year on Instagram and Threads. For a comparison focused on Twitter/X, I turn to Fast Company explaining Why Everyone Is Leaving X for Bluesky!

The breakdown of Bluesky's ascendant year and what they plan to do next.
That's a good capsule summary that accords with my experience. For more detail, I turn to Virtualization of the Public Sphere - Exodus of Users from X to Bluesky by Atmiki Pai.

Today, we will be discussing the virtualization of the public sphere, taking a deeper dive into the rise and fall of social media platforms.
I agree with the findings about why users left Twitter/X for Bluesky, although the numbers show that Bluesky's growth has slowed. That indicates that the answer to BBC News asking "Will Bluesky be able to rival X or Twitter" is no, not any time soon. That's O.K., for reasons I described in CNBC describes 'How Bluesky Grew From A Twitter Side Project To An X Competitor'.
I've grown my followers faster on Bluesky than I ever did on any other platform. It took me 13 years to get to 1,000 followers on Twitter/X. It took me one month on Bluesky. I now have nearly 3,000 followers two-and-one-half months after I joined. That's almost triple the 1,075 friends and 174 followers I have on Facebook, the next largest audience I have on social media, and that took 17 years to achieve. I'm also getting more engagement in the form of likes, reposts, and replies on Bluesky than X, although Facebook still beats both, but not enough link clicks from Bluesky to register, while X ranks in the top five. I'm not deactivating my X account for just that reason; it's still useful.
Six months after I joined Bluesky, I now have more than 6,300 followers. Bluesky's growth may be slowing down, but mine isn't and I'm getting even more engagement there than on Twitter/X, particularly since only post on the latter once a day while I'm consistently active on Bluesky. It doesn't help that Twitter/X's analytics are now a service for paid subscribers, and I won't pay to support Elon Musk, so they end up being little better than what I can collect from Bluesky for free.

Follow over the jump for the blog's top shares on Bluesky and Twitter/X between March 21, 2024 and March 20, 2025, the 2024-2025 blogging year.

Monday, December 30, 2024

'2024 becomes the world's hottest year on record, fueling extreme weather events,' the year in climate and weather

As I promised yesterday, it's time to review the year in climate and weather beginning with France 24 English reporting 2024 becomes the world's hottest year on record, fueling extreme weather events.

In 2024, billions of people across the world faced climatic conditions that broke record after record: logging ever more highs for heat, floods, storms, fire and drought. As the year drew to a close, the conclusion was both blatant and bleak: 2024 was the hottest year since records began, according to European climate scientists. Story by Alice Brogat, Axelle Simon and Eliza Herbert.
Seeing this reminds me of the first two questions I ask my students while watching Chasing Ice.
1. Chasing Ice opens with a montage of natural disasters. Name three of them.
The three that come to mind are floods, fires, and droughts. All of those, along with dangerous heatwaves and stronger hurricanes and tropical cyclones, appear in this report. For what it's worth, those are also among the possible answers to a question I ask about Treasures of the Earth: Power: "What are the expected effects of global warming? List three examples." Back to Chasing Ice.
2. How many of the past 20 years, as of 2012, were the hottest on record?
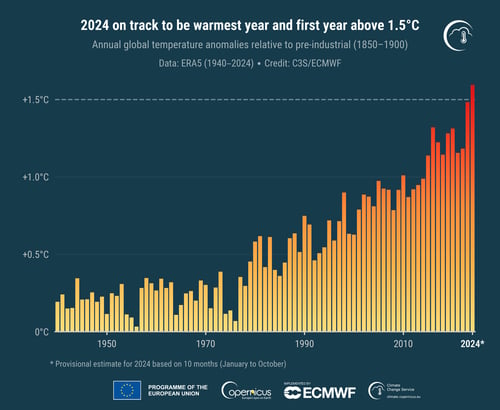
As of 2012, 16 were the hottest on record. According to the image below, it looks like it's now 17, as 1998, 2002, and 2003 fall outside the past 20 years, although the past ten years remain the hottest decade on record.


Yikes!
First, welcome to the 400 ppm world. Second, are you scared enough by climate change? My readers should be.
Firstpost from India has more, including some good news, in Greening Antarctica, Flooded Sahara: 2024 - Year of Climate Change | Firstpost Earth Year Ender.

2024 has been a landmark year for climate change, with record-breaking heat and extreme weather events dominating the globe. From the Sahara’s rare floods to the Arctic’s rapid melting, the planet is feeling the heat. But there’s hope too—renewable energy is booming, and conservation efforts are gaining momentum. Join us as we reflect on the highs and lows of a tumultuous year.
Good news that I can share with my students, but not nearly enough to inspire me to post Professor Farnsworth. Still, welcome to blogging as professional development.

I conclude with ABC News reporting on the Billion-dollar disasters of 2024.

The National Oceanic and Atmospheric Administration says the total cost of disasters this year was $61.6 billion.
I'm recycling my reaction from 'Weathered: Earth's Extremes' asks 'What Happens When the Land Runs Out?'
I close by recycling another program note from 'The "dirty side" of a hurricane, explained' by Vox.
So far, this season's 18 named storms, including 11 hurricanes and 5 major hurricanes, have borne out NOAA's 'Most Aggressive Hurricane Season Forecast On Record' for 2024, which predicted 17–25 named storms, 8–13 hurricanes, and 4–7 major hurricanes. I might revisit this and other forecasts next month. Stay tuned.
I have two more weeks to do this, so stay tuned for this year's version of 2023 is the hottest year on record and other climate and weather stories. That's when I plan on posting the follow up.
There's been no change since I wrote this, so I think ABC News's report suffices.

It's early enough that I might post an entry about the year's best TV shows today. Stay tuned to see if I do, followed by the overall year in review for New Year's Eve.

Saturday, May 25, 2024

Detroit's population increases for first time since 1957

I am sharing good news that I didn't expect to happen this soon, Detroit reversing its population decline. I begin with Click On Detroit/WDIV 4 reporting Detroit population rises after decades of decline last week.

Detroit had seen an exodus of people since the 1950s. Yet the estimates released Thursday show Detroit's population rose by just 1,852 people from 631,366 in 2022 to 633,218 last year.
That's a great use of graphics to give the numbers impact and make people pay attention to them!

CBS Detroit provided more context and human interest in their report, Detroit sees population growth for first time since 1950s.

After decades of decline, Detroit's population population is finally growing once again, according to new estimates from the U.S. Census Bureau.
This is such good news that it's enough to make me repost Professor Farnsworth.


I haven't shared this particular meme since 2022, so it's a big deal.

I can't let this silver cloud pass without showing its dark lining, which WDIV reported in Experts call for action as population in Michigan dwindles on March 21, 2024.

Michigan's population growth is among the worst in the nation, and it has experts sounding the alarm for some action in Lansing.
Michigan being a climate haven in a warming world will not be enough for more people to move here. The state has to makes itself and especially its cities more appealing, as I wrote last year.
I'm in favor of getting people to move here, both because it's a safer place to live (but not immune from the extreme weather associated with climate change as the second video mentioned) and because the state has room. Detroit alone lost more than one million people since its 1950 peak and other Michigan cities have lost people as well, so they alone could take up the slack — that is, if they can become better places to live and work. People moved out of Michigan to seek work, so state and local governments need to work with businesses to promote and create sustainable industries to employ the people who move here and rebuild infrastructure to support them in a warmer and, for Michigan, wetter world. Infrastructure and housing construction to accommodate people moving here will provide a lot of jobs by themselves, but that only lasts so long. Ask Las Vegas, for example.
Looks like Detroit is succeeding in this department. Just the same, it needs to improve its mass transit, as CityNerd ranked metro Detroit as the fourth worst city in the U.S. for transit. I might share his video next week for a driving update. Stay tuned, after tomorrow's Sunday entertainment feature, where I plan on writing about Ticketmaster.

Saturday, May 11, 2024

Social Security's top ten U.S. baby names of 2023 for Mother's Day weekend

Happy Mother's Day weekend! As I promised yesterday, I'm posting this year's edition of 'Social Security’s Top 10 Baby Names of 2022' for Mother's Day. Watch Social Security’s Top 10 Baby Names of 2023.

Just arrived! Find out the top 10 baby names of 2023 from Social Security, the source for the most popular baby names each year!
Oh, look, Martin O'Malley! I don't think I've mentioned him here since Serious and silly about how the Iowa Caucuses work from CBS News, Samantha Bee, and 'The Good Wife', when I remarked that he participated and then dropped out. I'm glad to see him in the federal government. Way to land on his feet!


Last year, I wrote "a name I've been tracking for years, Mateo, the name of Jane's son in 'Jane the Virgin,' continued its rise to eleventh from fifteenth in 2021, twentieth in 2020, 26th in 2019, and 37th in 2018. I wouldn't be surprised if Mateo reached the top ten this year or next." Mateo made the top ten in a big way in 2023, soaring to sixth. I'm not surprised Mateo made it, just that the name got this high this soon. Theodore also made a move from tenth last year to seventh this year. On the other hand, Henry and Lucas both dropped one place, William fell from sixth to tenth, and Benjamin dropped out of the top ten entirely to eleventh!

All ten of last year's girls names remained in the top ten with only Mia leapfrogging over Isabella and Ava to shuffle the order. Even Harper, which fell out in 2022, stayed in eleventh. On the topic of girl's names, Xiomara, another name from Jane the Virgin I've been tracking, continued gaining in popularity, rising to 402 in 2023 from 493 (corrected from 494) in 2022, 551 in 2021, 606 in 2020, and 652 in 2019. Jane itself managed to reverse its long-term slide in popularity, rising nine places to 281 from 290 in 2022 and 265 in 2021 after peaking at 261 in 2020. Whew! Finally!


On the topic of baby names increasing in popularity last year, CBS News examined those in "Chozen" and "Emryn" are rising fast as most popular baby names of the year are revealed.
While some names didn't break into the top 10, they proved to have grown in popularity. The name Emryn for girls jumped 1,287 places, coming it at No. 888 on the list. Fastest-rising boys name Izael burst into the top 1,000 in 2023, landing at No. 806.

Chozen also spiked, becoming the second-fastest rising boys name, coming it at No. 813. In the Netflix show "Cobra Kai," the character Chozen becomes the hero at the end of the fifth and latest season, which aired in September 2022 and could've had an impact on the baby name trend.

The fastest-rising name for girls may have also been influenced by media – social media, that is. Kaeli, the name of YouTuber and TikTok star Kaeili McEwen, rose 1,692 spots. The content creator, who goes by Kaeli Mae, has 14.8 million followers on TikTok and is known for lifestyle videos focused on cleaning and organizing.

Another popular boy name has a connection to social media. Content creator Wyatt Eiden, who has 3.1 million followers on TikTok, is known for quizzing strangers on the street and giving out prizes. His last name, Eiden, is the third-fastest riser on the boy name list.
That's an analysis I couldn't have written myself!

I'm briefly calling attention to the fourth-fastest rising name on the boys list, Cassian. It's the given name of the protagonist of Rogue One and Andor and is thus a Star Wars name. I plan on covering those names for Father's Day weekend. In the meantime, stay tuned for a Mother's Day edition of Saturday Night Live.

Tuesday, August 29, 2023

CNBC asks 'Roundabouts Are Safer. So Why Does The U.S. Have So Few Of Them?' A driving update

For today's short video post, I'm sharing CNBC asking Roundabouts Are Safer. So Why Does The U.S. Have So Few Of Them?

Roundabouts - the circular intersections seen all over Europe and elsewhere in the world - are said to be far safer than traffic lights. Research shows they reduce crashes, clear up congestion and save cities quite a bit of money. They have a heritage in the U.S., but America has a fraction of the roundabouts that far smaller countries like France, Spain and the United Kingdom have. But there are some states that are adopting them, and one small town in particular: Carmel, Indiana. The people of Carmel love their roundabouts and the mayor credits them with helping revitalize his city. So are they all they’re cracked up to be? And if so, why hasn’t the U.S. adopted them?
This video does a great job of presenting the pros and cons of roundabouts. They save energy, improve traffic flow, save lives, reduce injuries, and save money on traffic lights. I knew all that, but I didn't know they increase collisions with bikes unless they include protected bike lanes. It's always a good day when I learn something new.

That's the big picture. Now for my personal driving update.


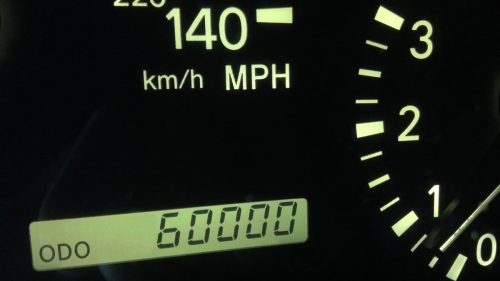
Pearl will pass 60,000 miles today, which will be 88 days after she passed 59,000 miles on June 1, 2023. That translates to 11.36 miles per day, 349.59 miles per standard month, and 4,147.73 miles per standard year. That's more than the exactly 10 miles per day, 305 miles per standard month, and 3650 miles per standard year I drove her between passing 58,000 miles on Tuesday, February 21, 2023 and June 1, 2023. That's not what I expected because I drove less for work this summer than this spring. Most likely it's because I drove a lot of those miles this spring on Snow Bear during bad weather and drove Pearl more while the weather was good. Let's see what the next updates of both vehicles show as the weather worsens during the fall.

Looking at my driving another way, it will have been 383 days since Pearl passed 56,000 miles on August 10, 2022 for averages of 10.44 miles per day, 318.54 miles per standard month, and 3,812.01 miles per standard year. In contrast, it took 434 days to me to drive Pearl 4,000 miles between March 24, 2022 and June 1, 2023, which becomes 9.22 miles per day and 3,364.06 miles per year. I'm definitely driving Pearl more, and my wife has resumed driving Snow Bear regularly, so I expect our total mileage will increase when I update driving on that vehicle. It will still be below the pre-pandemic peak, just like for the nation as a whole.

Thursday, July 6, 2023

Three hottest days on record this week and it's only Thursday

Climate change is back in the news as France 24 English reported Hottest days on Earth: Third straight day of record-breaking highs across planet this morning.

The last three days marked the hottest days the world has seen -- at least since official record taking began 44 years ago. Scientists though say they were likely the hottest days in centuries and that the record could be broken several more times this year. FRANCE 24's Andrew Hilliar explains.
Chris Hayes on MSNBC reported World records its hottest days ever this week on the first and second days' record average global temperatures last night.

Chris Hayes on the rise of the global temperature: "It's like going from a normal, 98.6 degree body temperature to spiking a 101.3 degree fever. At 101.3 degrees, you are pretty sick—and that metaphor is almost literal because the human body really struggles in high heat."
Bill McKibben's statement that these are the hottest days "since sometime during the last interglacial period 125,000 years ago" reminds me of what I wrote last year: "It's bad enough that we're on track for Pliocene temperatures at current rates of warming." The Sangamonian (in North America) and Eemian (in Europe) would be the first milestones on a temperature journey to 3.6 million years ago, a trip I hope we don't complete.

Speaking of milestones, I'm embedding a tweet from the Keeling Curve Twitter account showing a new atmospheric carbon dioxide record. Welcome to the 400 ppm world.

Friday, August 12, 2022

Average gas price falls below $4.00, a driving update

I begin today's driving update with a report on falling gas prices. The Today Show is up first with Gas Prices Fall Below $4 But Housing, Food Prices Continue To Climb.

The national gas average dipped below $4 for the first time since March on Thursday, signaling record inflation could be cooling off. NBC’s Tom Costello reports for TODAY.
That was good news for the consumer on gas prices, but bad news about other goods, indicating continuing high inflation. That's a topic I'm very likely to return to.*

Newsy dug deeper into the reasons for the fall in gas prices along with a warning that the drop might not last in Gas Prices Have Dropped, But The Relief Might Not Stick.

Though gas prices are going down, the war in Ukraine, higher demand or hurricanes could impact the trend.
The U.S. has been lucky, as NOAA predicted another above average Atlantic hurricane season for 2022 but no named hurricane has formed yet, just three tropical storms. Don't worry, or do worry, as the case may be, as the heart of hurricane season is yet to come and the various forecasting agencies are still predicting a more active than average season.

The guest in CNBC Television's Cinquegrana: There's still a little more downside for gas prices before it pauses and maybe reverses expressed both relief that no hurricane has hit the oil-producing and refining part of the U.S. Gulf Coast and worry that one could.

OPIS chief oil analyst Denton Cinquegrana discusses the move in retail gas prices below $4 a gallon for the first time in months, and what risks lie ahead for the energy market.
I'll be sure to keep an eye on the weather for this reason and others.

Follow over the jump for my personal driving update.

Wednesday, July 27, 2022

John Oliver examines inflation plus 'Last Week Tonight's Emmy nominations

I concluded Wall Street Journal and CNBC explain 'Why a 2022 Recession Would Be Unlike Any Other' by telling my readers "I may have more about the economy, guns, or the Emmy Awards tomorrow. I may even combine two of them. To find out, stay tuned." I'm combining the economy and the Emmy Awards, first by sharing Inflation: Last Week Tonight with John Oliver (HBO).

John Oliver discusses what causes inflation, what we’ve done about the current round of it, and, of course, makes the smartest investment of all time.
Jim Cramer is funny enough, but Oliver making fun of him dials it up to eleven. On a more serious note, I mentioned inflation driving down consumer sentiment in CNBC explains 'Why Recessions May Be Inevitable', which could cause a recession. I've mostly been focused on gas prices as a sign of inflation, but those have been declining for the past month. That's normal. I tracked gas prices for years and found that they rise and fall seasonally, with prices increasing from the beginning of the year to the July 4th weekend and then falling through the end of the year. What I found concerning was that gas prices rose last fall when they should have been falling. That was a sign that something had changed, notably that supply could not keep up with demand. That seems to be Oliver's point, that this is a prolonged and global supply issue, not an American money supply issue, and it's throughout the economy, not just confined to oil. That's something else I predicted for the second half of this decade. Maybe the peak of oil from fracking has arrived early. That's not good news unless one wants to buy a bike.

I do have some good news for "Last Week Tonight with John Oliver," the show's Emmy nominations. Follow over the jump.

Wednesday, July 20, 2022

Apollo 15 and 16 and the Lunar Rover 50 years later for Moon Day 2022

Happy National Moon Moon Day! For today's anniversary of Apollo 11 landing on the Moon, I'm looking back at Apollo 15 and Apollo 16, the two missions whose 50th anniversaries occurred since the last Moon Day. I begin with Seeker's video covering both missions, but focusing mostly on the Lunar Rover, How Did NASA Engineer a Car for the Moon?

NASA’s first car to drive on the Moon revolutionized space exploration, giving astronauts the ability to travel farther than ever before.
SciShow Space also devoted one of its episodes to the Lunar Rover, What We Learned by Putting Cars on the Moon.

To expand their range on visits to the moon, astronauts needed a way to travel faster, go farther, and carry more than walking provided. Thankfully, they had the Lunar Roving Vehicle.
Both of these videos demonstrate how NASA and Boeing created a lunar vehicle and how a car on the Moon allowed the lunar astronauts to perform more and better science.

NASA also remembered both missions, looking at them as wholes, not just through the lens of their most visible technological achievement, as interesting and significant as it was and still is. To celebrate the mission's 50th anniversary, NASA uploaded Apollo 15: "Never Been on a Ride like this Before".

Our first wheels on the Moon. On the Apollo 15 mission, the Lunar Roving Vehicle allowed the astronauts to cover a much greater distance on the Moon than the previous three flights had accomplished. This year marks the 50th anniversary of the Apollo 15 mission. On July 26, 1971, David R. Scott (Commander), James B. Irwin (Lunar Module Pilot) and Alfred M. Worden (Command Module Pilot) launched from Kennedy Space Center’s Launch Complex 39A.

Apollo 15 set several new records for crewed spaceflight: heaviest payload in a lunar orbit of approximately 107,000 pounds, maximum radial distance traveled on the lunar surface away from the spacecraft of about 17.5 miles, most lunar surface moonwalks (three) and longest total of duration for lunar surface moonwalk (18 hours, 37 minutes), longest time in lunar orbit (about 145 hours), longest crewed lunar mission (295 hours), longest Apollo mission, the first satellite placed in lunar orbit by a crewed spacecraft, and first deep space and operational spacewalk.
That is an impressive list of records! Also, I remember watching as the hammer and feather hit the lunar surface at the same time, demonstrating that Galileo was right.

NASA Goddard observed the 50th anniversary of the Apollo 16 mission with Apollo 16 Lands in the Lunar Highlands.

Thanks to data provided by the Lunar Reconnaissance Orbiter mission, we are able to visualize the Apollo 16 landing site in the Descartes highlands on the nearside of the Moon, where the astronauts landed in April 1972. The mission was crewed by Commander John Young, Lunar Module Pilot Charles Duke, and Command Module Pilot Thomas K. Mattingly. This visualization contains audio transmissions from portions of the mission between the astronauts and CapCom James Irwin, and a view of the 3 EVA (extravehicular activity) routes the astronauts took over the course of three days, including their visit to North Ray crater. The experiments conducted and lunar samples collected by the crew are still providing valuable data about our Moon to scientists today.
Apollo 16 may not have been as flashy, but it was still important for understanding the Moon.

That's it for this look back. I plan on finishing this series next year with the 50th anniversary of Apollo 17, the last Apollo mission to the Moon. In the meantime, stay tuned as I return to the present day.

Friday, May 6, 2022

Star Wars drinks and music for Revenge of the Sixth on Flashback Friday

Beware the Revenge of the Sixth, the dark side of Star Wars Day! For this year's celebration, I'm combining the drinks and music themes of 2018 and 2020 with the retrospective theme of 2021.

I begin with a review of fictional drinks from the Star Wars franchise by Star Wars: Top 10 – Alcoholic Beverages by Inside Star Wars.

Sometimes, especially in a galaxy far, far away, you've just got to loosen up. And what better way to do so than drinking yourself into oblivion! I'm noel from TheCancrizans, and here are the top 10 alcoholic beverages in Star Wars.
Now for the music from the Dark Side, The Mandalorian: Moff Gideon Theme | EPIC IMPERIAL VERSION by Samuel Kim Music.

The Mandalorian Theme by Ludwig Göransson
Star Wars Theme by John Williams
Arranged and Orchestrated by Samuel Kim.
Also "Long Live the Empire" by Ludwig Göransson.

That's it for the fan celebration of Star Wars. Follow over the jump for retrospective about the blog's year on Pinterest.

Saturday, November 20, 2021

Trevor Noah and 'The Daily Show' explain why gas prices are so high

I explained that CNBC's explanation of 'Why Gas Prices In The U.S. Vary' was incomplete.
That's a very good explanation of why gas prices are different from state to state and region to region in the U.S., although it captures only part of the reason. The other is increased demand in the face of lower supply, something I've worried about for a while, most recently in Oil falls below $0.00 for the first time ever, when I wrote "the collapse in oil prices will lead to oil company bankruptcies, which will decrease competition and lead to higher prices in the future." Those higher prices because of decreased competition and restrained supply have arrived and I think they will last at least until next year. Get used to them.
The Daily Show with Trevor Noah focused on the reason why gas supplies are constrained in The Real Reason Gas Prices Are So Damn High | The Daily Show.

Why have gas prices increased so dramatically, and why does it seem so hard to fix this issue? Find out in another edition of Getting Back to Normal-ish.
That's pretty much it. The U.S. is unable to pump as much oil now as before the pandemic, in part because it's going to take a while to reopen the old wells that will still yield oil and drill new wells to replace those that can't. In addition, I predicted that oil production would start decreasing about now in The tax bill and the U.S. economy in 2018 and beyond.
Beginning in 2020, it's predicted to decline. That will cause oil prices to increase from 2021 to 2029 unless more oil is imported, which will reduce GDP as the money leaves the country, or Americans decrease their consumption.
Oil and gasoline prices are increasing as I predicted four years ago, more or less on schedule. Speaking of my predictions, I remarked on another in my comment to What We Can Still Accomplish at Ecosophia in July.
As for the upcoming oil price spike, that's been associated with recessions in the U.S. since the country hit peak conventional production in 1971. At first, the current recession seemed to have severed that link, but now we are going to get it as a result of supply destruction because of lowered demand and prices (even negative prices for oil futures last year) followed by a spike in demand because of recovery. The causation between high oil prices and hard times may be reversed, but the correlation will survive. Now let's see if it takes another six years like it did between 2008 and 2014 for high prices to prompt more supply coming online or if supply of petroleum and natural gas liquids finally has peaked.
I suspect it may take even less time for oil prices to fall, but not to where they were during or before the pandemic. That may not happen until the next recession, which I still think will happen around 2027. As I wrote about high and increasing prices for gas and other goods, get used to them.

Saturday, November 18, 2017

Home ownership rate and me, three years later


I made a programming note in one of the footnotes to November 2017 driving update for Pearl plus Tesla Truck and Chevy Bolt news.
Yesterday was also the third anniversary of putting an offer on my current home and having it accepted.  I plan on writing about that and my prediction that the U.S. home ownership rate would start going up tomorrow.
Here's what I wrote three years ago Thursday.
I showed my hand to Greer later in the entry, when I wrote, "Now to see about buying property as it struggles off the bottom."  Well, that time has arrived.  We've made an offer on a house and it's been accepted.  Wish my wife and me luck as we both get on board, just in time for the housing market to go back up.  Yes, it's a business as usual decision and I know these are not business as usual times, but as I'm fond of saying, I can't be all DOOM all the time.
It took just over a year and a half for the home ownership rate to rise, as the Washington Post managed to document the bottom in Why the decline of the homeownership rate is good news.
The U.S. homeownership rate has just fallen to its lowest level since the Census Bureau began tracking it in 1965.

During the second quarter of this year, only 62.9 percent of U.S. households were owner-occupied residences, down from the all-time high of 69.2 percent reached in the fourth quarter of 2004.

Contrary to entrenched conventional wisdom, however, the ongoing decline of the homeownership rate is actually good news.

Here’s why: Thanks to recovering real estate values, today’s homeowners as a group have the same equity in their property — roughly 58 percent — that the record-size cohort did back in late 2004, according to the Federal Reserve. Ergo, there’s now more equity, on a per- household basis; current homeowners’ tenure is that much more sustainable and secure.

“They are now more able to weather an economic disaster,” says Ralph McLaughlin, chief economist of Trulia.com, the online home-listing service.

To put it another way: The United States actually has more homeownership, in economic terms, than it did when the homeownership rate, a measure of mere legal ownership, was higher. Accordingly, the economy should also be less vulnerable to another real estate shock.

We’re still not back to the rock-solid days of 1983, when the homeownership rate was a hair under 65 percent and equity hit an all-time high of 70 percent.
The following graph from the St. Louis Federal Reserve shows that previous peak in home ownership rate and then some back to the 1960s.  It also shows how small and recent the rebound in home ownership rate is.


Just the same, I'm glad to have jumped on the trend just before it turned around, just like I did the last two times when my ex-wife and I bought in 1994 (not 1995, as I misremembered), which was a little ahead of the rapid rise in home ownership, or before it accelerated, like when I sold in 2006, a couple years after the peak but before the bottom fell out of both housing values and home ownership rates.  As I wrote three years ago, "I shouldn't be reassured by moving with the herd, but in in this case, I am."

Saturday, June 24, 2017

Driving update for June 2017: Dez


I mentioned my wife's car in Driving update for June 2017: Pearl plus Tesla worth more than GM or Ford.
I was hoping for fewer miles because of a week off and not having [to] make up for Dez not being in the shop, but apparently I managed to drive slightly more just the same.  However, I'll have to wait until Dez passes 55,000 miles to see what the total driving impact for the family really is.  That should happen late this month or very early next month.
Dez passed 55,000 miles on Wednesday the 21st, so it's time for another driving update.

It took my wife 85 days to drive Dez 1000 miles, which translates to 11.76 miles per day and 358.82 miles per standard month.  That's more than the average of 7.19 miles per day or 219.42 miles per standard month she drove Dez between November 2016 and March 2017.  The reason for the increased driving is the same one that I cited in March for Pearl not getting a third update since November before Dez got her first; my wife drove the car to Chicago and back to visit our daughter.  More of that trip accrued to this update than the last one.

As I mentioned above, the important statistic is how much both of us drove our cars.  During the same 85 days that my wife drove Dez 1,000 miles, I drove Pearl 1,650 miles for a total of 2,650 miles.  That translates to 31.18 miles per day and 950.88 miles per standard month.  That's more than the 26.26 miles per day and 800.90 miles per month we drove between November and March.  It's also more than the 24.93 miles per day and 760.4 miles per standard month we drove both cars over the comparable period last year.  It's amazing how much one trip to Chicago and back affects total miles driven.  Let's see if the next update shows us returning to last summer's baseline.

Speaking of baseline, it's time for a comparison of our driving habits to those of the rest of the country.  From Doug Short.
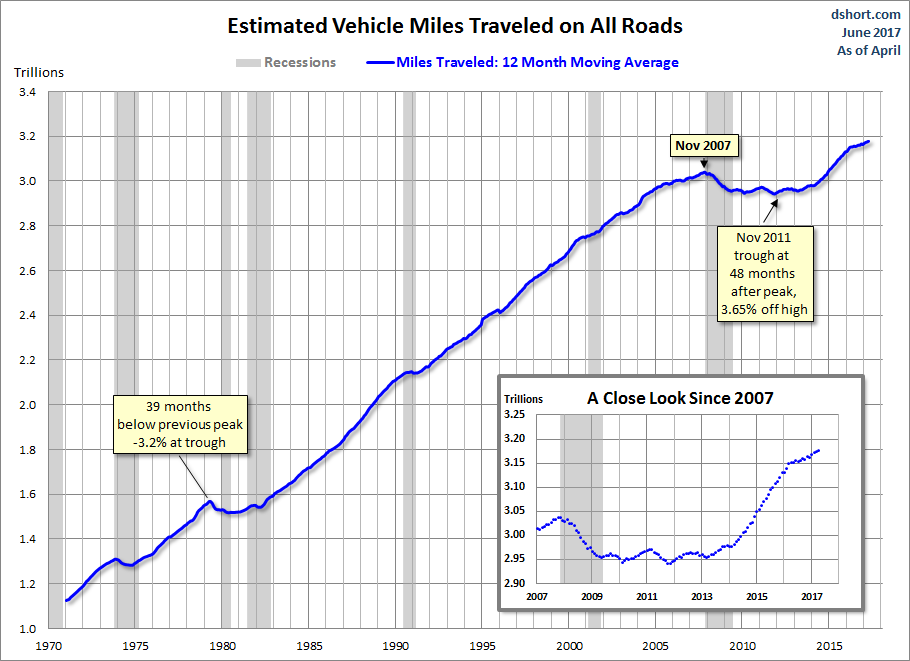
The Department of Transportation's Federal Highway Commission has released the latest report on Traffic Volume Trends, data through April.

"Travel on all roads and streets changed by 1.2% (3.3 billion vehicle miles) for April 2017 as compared with April 2016." The less volatile 12-month moving average was up 0.1% month-over-month and 0.8% year-over-year. If we factor in population growth, the 12-month MA of the civilian population-adjusted data (age 16-and-over) is up just 0.04% month-over-month and up only 0.2% year-over-year.

Here is a chart that illustrates this data series from its inception in 1971. It illustrates the "Moving 12-Month Total on ALL Roads," as the DOT terms it...The latest data point is another all-time high.

Looks like my wife and I are contributing to the trend of increased driving.  That might increase more, as oil and gas prices are down year over year, but that's a story for another entry.  In the meantime, stay tuned for the Sunday Entertainment Feature.  I plan on writing about the Television Critics Association Awards.

Saturday, November 12, 2016

Double driving update for November 2016


Both cars turned over their odometers this week, so its time for a double driving update, just like the one I wrote for September.  Pearl passed 30,000 miles on Tuesday and Dez passed 53,000 miles on Wednesday.  After doing the calculations, Dez's odometer showed 52,000 miles on September 19, while Pearl's was at 29,000 on September 21 (happy birthday to me!)  Those mean that it took me 41 days for me to drive Pearl 1,000 miles and my wife 44 days to drive Dez the same distance.   That means I drove 24.39 miles/day and 743.90 miles/standard month while my wife traveled 22.73 miles/day and 693.18 miles/standard month over the past seven weeks.  Combined, we drove our cars 47.12 miles/day and 1437.08 miles/standard month since the last update.  Those are a lot more than the 17.54 miles per day and 535.1 (535.09) miles per standard month for Pearl, 6.90 miles per day and 210.34 miles per standard month for Dez, and combined 24.93 miles per day and 760.4 miles per standard month from September.  I drove as much during the past month-and-one-half as both of us drove during the previous two months!

So what changed?  I performed a lot of volunteering for the election, canvassing for candidates and dropping off lawn signs.  My wife visited our daughter in Chicago.  As long as gas is relatively cheap, we can afford to do things that are as high a priority as sustainability, such as family and politics.  The good news for our gas consumption is that the election is over and our daughter and her dogs will visit us for Thanksgiving.  In addition, I'll have fewer meetings to attend.  All that should reduce our driving considerably for the rest of the year, possibly even back to normal, which would be at or below 1,000 miles per month for both cars.

Our increased driving puts us in good company, as the Department of Transportation reported last month.
  • Travel on all roads and streets changed by 3.4% (9.3 billion vehicle miles) for August 2016 as compared with August 2015.
  • Travel for the month is estimated to be 284.9 billion vehicle miles.
  • The seasonally adjusted vehicle miles traveled for August 2016 is 268.6 billion miles, a 2.5% (6.5 billion vehicle miles) increase over August 2015. It also represents a 0.8% decrease (-2.2 billion vehicle miles) compared with July 2016.
  • Cumulative Travel for 2016 changed by 3.1% (65.3 billion vehicle miles).
  • The cumulative estimate for the year is 2,152.4 billion vehicle miles of travel.
Calculated Risk displayed the data showing the increased miles driven for all Americans.


True, we actually did not contribute to the higher miles driven during August, as we actually drove less this August than last August, as I reported in Pearl's driving update for December 2015, but I'm sure we'll add to the increased driving for September through November.

Stay tuned for the Sunday entertainment entry.  Leave a comment here or surf over the the blog's Facebook page to vote for the topic of tomorrow's entry.  The choices are box office and reviews for the opening weekends of "Arrival" and "Fantastic Beasts and Where to Find Them" and how they compare to "Doctor Strange," more on "Westworld," trailers for "Rogue One" and "Wonder Woman," marches for the winners of the Electoral College and the popular vote, or write-in votes for any other entertainment topic (ETA: such as the death of Leonard Cohen, whose music I've used twice).  I count those, as last Sunday's entry shows.  That was decided by one person.  It could be you.

Monday, August 1, 2016

Stocks resume climbing a wall of worry to hit new highs


I concluded the section before the jump in All Hell breaks loose after the U.K. votes to leave the E.U. with this caveat.
If this continues, and the Dow goes into a correction over the next few months that takes it to below 14,650, it makes both Mike Alexander's prediction of a 10,000 point decline in the Dow by the end of 2018 more likely and my prediction of a recession beginning by the end of 2017 more likely to come true.
That didn't happen.  Instead, this did: Red-hot Dow rises for 9th day in a row.
The stock market is so hot that the Dow just notched a rare nine-day winning streak.

It's only the seventh time since 1980 that the benchmark index has climbed that many days in a row, according to the New York Stock Exchange.

More impressive, the Dow continues to rewrite the record books, closing on Wednesday at yet another fresh all-time high of 18,595.

It's the latest milestone in what has been a wild summer for stocks. Global markets plunged on June 24 after the Brexit referendum in the U.K. spooked investors. But stocks soon raced back emphatically, and just kept rising until they took out the records set in May 2015.

"We're setting new records, but don't forget it took us 14 months to get here," said Art Hogan, chief market strategist at Wunderlich Securities.
That was on July 20th.  Two days later, Barrons reported "The S&P 500 rose 0.6% this week after gaining 0.5% to 2,175.03 today, a new record high."  That's not all, as the last Friday of July saw a new intraday high, as Reuters reported.
Wall Street rose on Friday, with the S&P 500 index hitting a record intraday high for the seventh time this month as gains in technology heavyweights Alphabet and Amazon more than made up for losses in energy shares.

The benchmark index rose as much as 0.3 percent, touching an all-time high of 2,177.09, and completed its fifth straight month of gains.
So, will Mike and I end up being wrong?  Not yet.  Follow over the jump for why.

Saturday, May 21, 2016

WXYZ on rising gas prices for May


Here's a video I could have used for Gas down while oil is up for May 2016, Gas prices spike in metro Detroit from WXYZ.

Drivers in metro Detroit may have noticed gas prices spiking in the area by nearly 20 cents in some places.
That price rise is showing up only weakly at the stations in my old neighborhood.  GasBuddy shows that regular has risen from $2.27 to $2.32 for the corner station and $2.29 for the stations down the street.

The Wall Street Journal reported higher prices than last week, listing Friday's closes for WTI at $47.75 and Brent at $48.72, both higher than the $46.21 and $47.83 a week ago today .  The good news is that both are lower than yesterday's prices, which are still on Oil-Price.Net, $48.16 for WTI and $48.81 for Brent, which were only a few cents below their closes on Wednesday, the highest of the year, when WTI hit $48.95 and Brent hit $49.85.  Credit firefighters keeping the wildfire from Alberta's oil sands for that change in the direction of oil prices.

RBOB has also risen week over week from $1.58 at the end of April through $1.59 last week to $1.64 today.  Like crude oil, that's lower than its peak earlier this year at $1.66, a nine-month high.  

The decline at the end of the week in energy futures suggests that price increases will likely stall out next week, at least until the Memorial Day weekend.  That should come as good news after the Detroit average jumping more than a dime from last week's $2.24 to $2.35 while the US average climbed from $2.22 to $2.28 over the same period.  On and especially after Memorial Day, I expect the seasonal increase from driving season will push prices up regardless of the price of oil.  The only question is how fast and how high.

Wednesday, March 30, 2016

Gas prices rise but are still (mostly) below $2


Two weeks ago, I wrote the following after the jump in Driving update for March 2016: Dez plus bonus gas price update.
When I last posted about gas prices, I wrote that the annual gas price rise had begun.  Then, the stations in my old neighborhood were selling regular for $1.66.  I decided to wait, as I thought gas should have been cheaper and thought it might even go down.  The next week proved me right, as I found those same stations selling regular for $1.50.  I filled up.  Two weeks later, which was last week, they were selling  the same grade for $1.73.  I decided I didn't need gas enough to buy and waited.  This week, the price went up to $1.78.  Given what the local price environment looked like, I decided it was a reasonable price for the time of year and filled up my tank again.

Was I right to think so?  GasBuddy says yes, as the Detroit average has been $1.96 all week.  The metro average may not be rising, but the national average is moving north of $1.98.
The metro Detroit average has only increased by a penny to $1.97, but the local price in my old neighborhood has continued to creep up.  Yesterday, the two stations down the street from the corner station were both selling regular at $1.90.  That's seven cents lower than the average, but thirteen cents more than two weeks ago.  However, both were a quarter below the corner station, which was advertising regular for $2.15.  Welcome to No Mans Land!  Meanwhile, the national average rose to $2.05.  Expect the seasonal gas price rise to continue.

That's the bad news.  The good news is that gas is 59 cents lower than it was this time last year.

While the retail environment is pushing the price a the pump up, the wholesale environment is not.  Oil-Price.Net shows yesterday's closes for WTI at $38.28 and Brent at $39.14, about $2 less than the $40.20 and $41.54 of two weeks ago.  Also, RBOB fell more than a penny to $1.45.  Those trends should moderate the rate of increase.

Follow over the jump for how falling oil prices fit into the larger market picture.

Thursday, September 24, 2015

Gas prices slightly up in old neighborhood to begin fall


When I last reported on the local gasoline market, I observed that the gas price spike was a dead cat bounce.  The stations in my old neighborhood were all selling regular for $2.24.  I followed that with two entries about the lowest gas prices for Labor Day in 11 years.  I then passed along that gas was already below $2 near Grand Rapids and that GasBuddy showed the stations in my former neighborhood all selling regular for $2.19.  I never actually saw those prices, but I did see enough to say that they rose and are now falling.

Last Thursday, all the stations in my old stomping grounds were selling regular for $2.37.  I decided not to fill up, as I expected prices to fall.  They did.  Tuesday, the corner station listed regular for $2.27 and the two stations down the street displayed $2.29 for regular.  I filled up Pearl at the corner station and not a moment too soon, as the dashboard display said the car had only two miles of gas left.  This is exactly where the price should be, as the Detroit average is currently $2.37.  That's up from earlier this month, both from the $2.31 just before Labor Day and from the $2.24 on the 16th.  Therefore, I don't expect prices to go down this week.

Early next week might be another story.  Oil-Price.Net lists yesterday's closes for WTI and Brent at $44.48 and $47.75 respectively, close to the lows for the month so far for both.  In addition, RBOB is selling for $1.38, two cents lower than the first week of September.  Whatever is driving up the price of gas in Detroit, it's not the wholesale price of fuel.  Consequently, I'm still expecting either the price in my old neighborhood or the average price in Detroit to fall below $2.00 between Halloween and Thanksgiving.

Monday, September 7, 2015

Record page views for August 2015 and other monthly meta


I expected a new page view record at the end of Monthly Meta for July 2015.  I got several.
Normally, I'd look ahead to my goals for this month, but I've already exceeded them. My minimum goal was 389 page views per day for a total of 12,059 page views for the month on no more than 44 entries.  The low goal was 402 per day for a total of 12,462.  My medium goal shot for a five percent increase over last year with 12,679 for the month via 409 per day.  The high goal was to reach 13,000 for the month to extend the streak, which would have taken 420 page views per day.  I hit the first on the 22nd and knocked out the rest on succeeding days.  I'm now at just over 14,000 with three days to go.  I can coast on one entry per day for a total of 38 posts and still set a new monthly record for page views.  Stay tuned to see if that happens.
It did.  The blog received 14,981 page views for 38 entries over 31 days, resulting in averages of 489.26 page views per day and 394.24 page views per entry.  All of those are new records.  There were also 41 comments, the most since February 2014, and a new record for the year.  I was right to be optimistic for more.

To celebrate these records, I'm sharing the top posts for the month, beginning with the most "liked" on Google Plus.  This month, it was "Donald Trump dance remix" posted August 18, 2015, which has 10 pluses on 65 page views.  For once, it didn't earn those "likes" by being shared at a community.  Instead, it got attention from my profile only.  It's the first of four posts about The Penguin Donald in this month's retrospective.  Keep reading for more.

Follow over the jump for the top ten entries, both overall and those posted during August, along with entries earning the most comments, which also happened to be among the most viewed.

Friday, August 28, 2015

Monthly Meta for July 2015


I first told my readers to "stay tuned for the monthly meta" at the end of Science Fiction and Fantasy at the 2015 Teen Choice Awards.  That was almost two weeks ago.  Since today is the last Flashback Friday of the month, it's well past time to follow through, beginning with the goals I set for myself in Monthly Meta for June 2015.
July 2014 saw 12,764 page views, so the minimum goal is for 412 page views per day for a total of 12,772.  The medium goal is 13,184 to finish a day ahead and 13,402 for a five percent increase, each of which will require 425.3 and 432.3 page views per day respectively.  I'm trying to do that while posting no more than 44 entries during the month.  So far, I'm meeting all these goals.  Wish me luck on doing so for the rest of the month.
The blog ended up with 13,378 page views for July 2015, making it the fifth consecutive month with more than 13,000 page views.  It earned 431.55 page views per day.  Both were a bit short of the high goals for the month, but I'm not too upset about it, as I easily beat the minimum and low goals and came close enough to the high goal.  Besides, I had an excuse; I only posted 34 entries last month, ten less than my self-imposed maximum.  Consequently, I achieved an average of 393.47 page views per post, which appears to be a record, exceeding April 2015's 374.74 page views per entry.  While I usually care more about page views per day, I'll take the record in views per entry.  Besides, readership is still up over last year, so I'm pleased.

As for comments, I'll let what I wrote last month speak for itself.
While I don't make goals for comments, as any efforts I make to prompt more are less effective and predictable than what I can do to increase page views, last month was another good one for people responding to my posts at my blog.  Readers left 36 comments last month, the highest since February 2014 with 42 comments.  This is also the most per month so far this year.  I'd be pleasantly surprised if I could do that again this month, but I have no expectations.
I was right to have no expectations, as readers and spammers left only 17 comments during July.  This month is already much better, as 39 comments have been left, including one entry with 10 comments.  The month is not yet over, so I'm optimistic for more.

Speaking of comments, the first entry I'm sharing in this month's retrospective is the one with the most comments left during July, Bald Eagle facts for 4th of July weekend from DNews, posted July 3, 2015, with 3 comments.  It was also the tenth most read entry posted last month with 97 page views according to the raw counter, a double honor.  It got its readership through being shared on Facebook.

Follow over the jump for the rest of July's most read entries.